Need help finding climate data? Please fill out our data request form and we’ll be in touch!
Filter datasets:
West Wide Drought Tracker
This tool allows the user to examine monthly time series and create maps of temperature, precipitation, or various drought indices (including Palmer Drought Severity Index and Standardized Precipitation Evapotranspiration Index) nationwide using PRISM data. Note: Requires creation of a free account for data access.
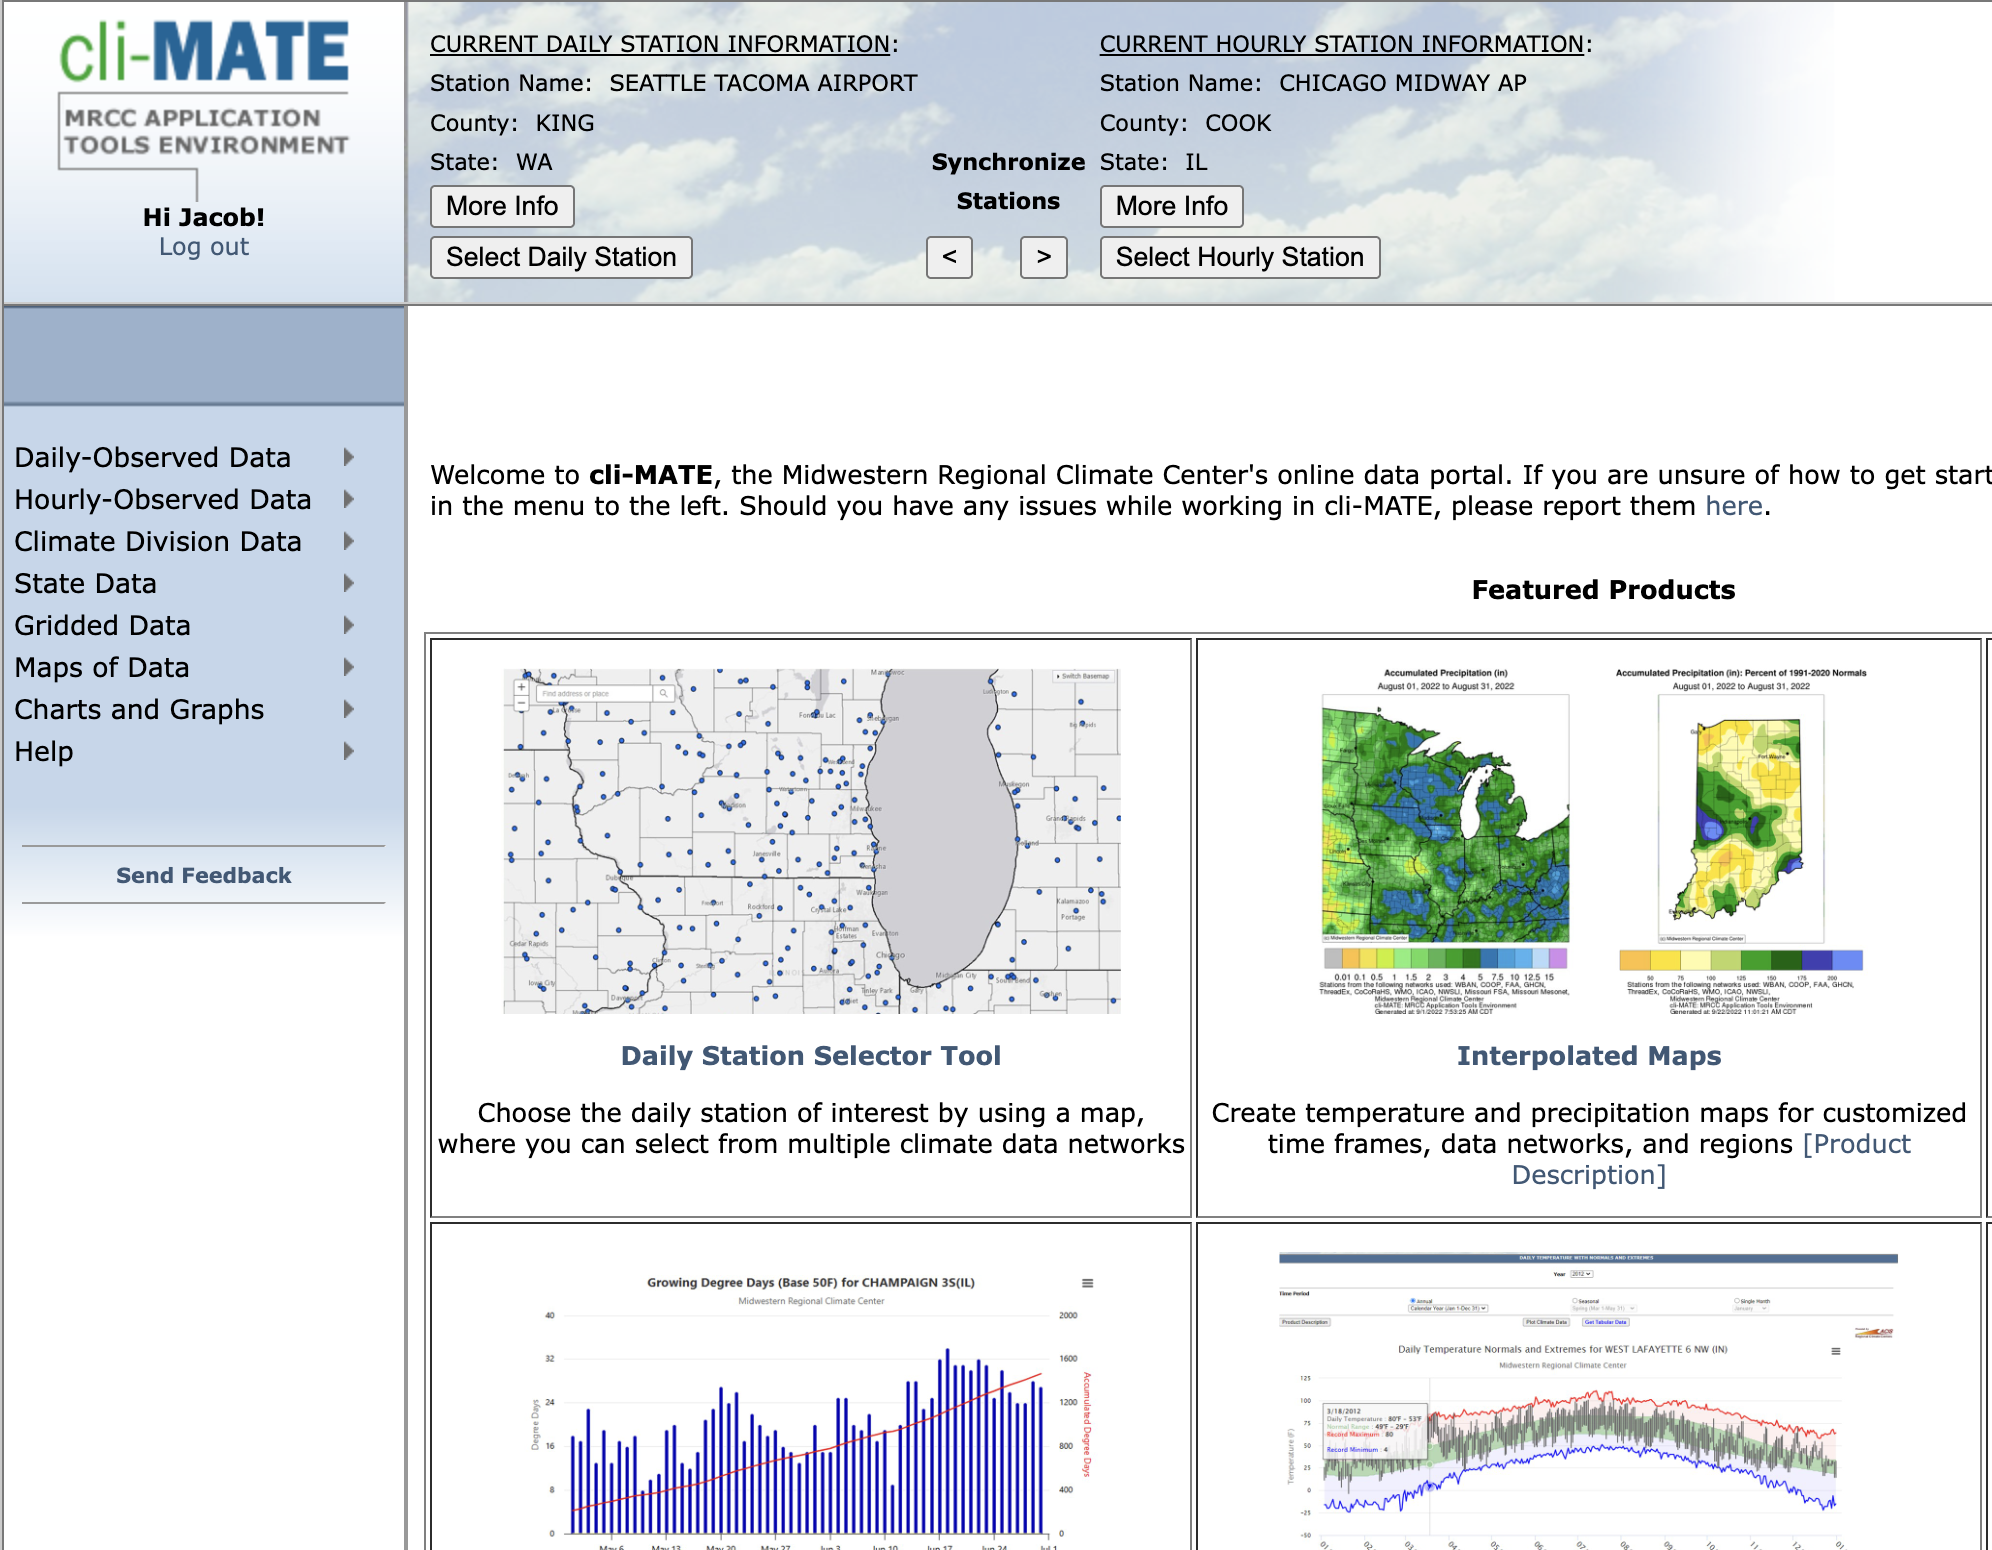
MRCC cli-MATE Tool
Access hourly, daily, monthly, and seasonal raw climate data, as well as rankings, thresholds, and graphics through for cli-MATE. This is a powerful tool that we highly recommend.
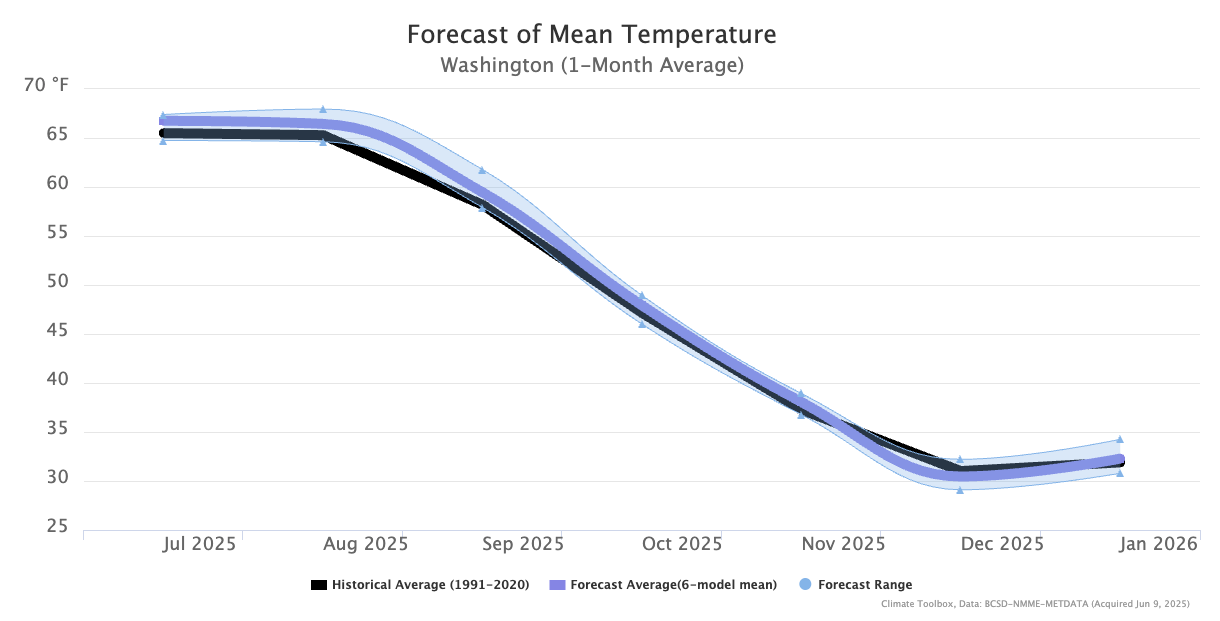
Climate Toolbox Seasonal Forecast Graphs
Explore experimental 7-month forecasts of monthly precipitation and temperature relative to historical (1991-2020) normals. Click on “set location” on the initial pop-up message and then enter “Washington State” in the GeoLocation box to view projections for Washington State.
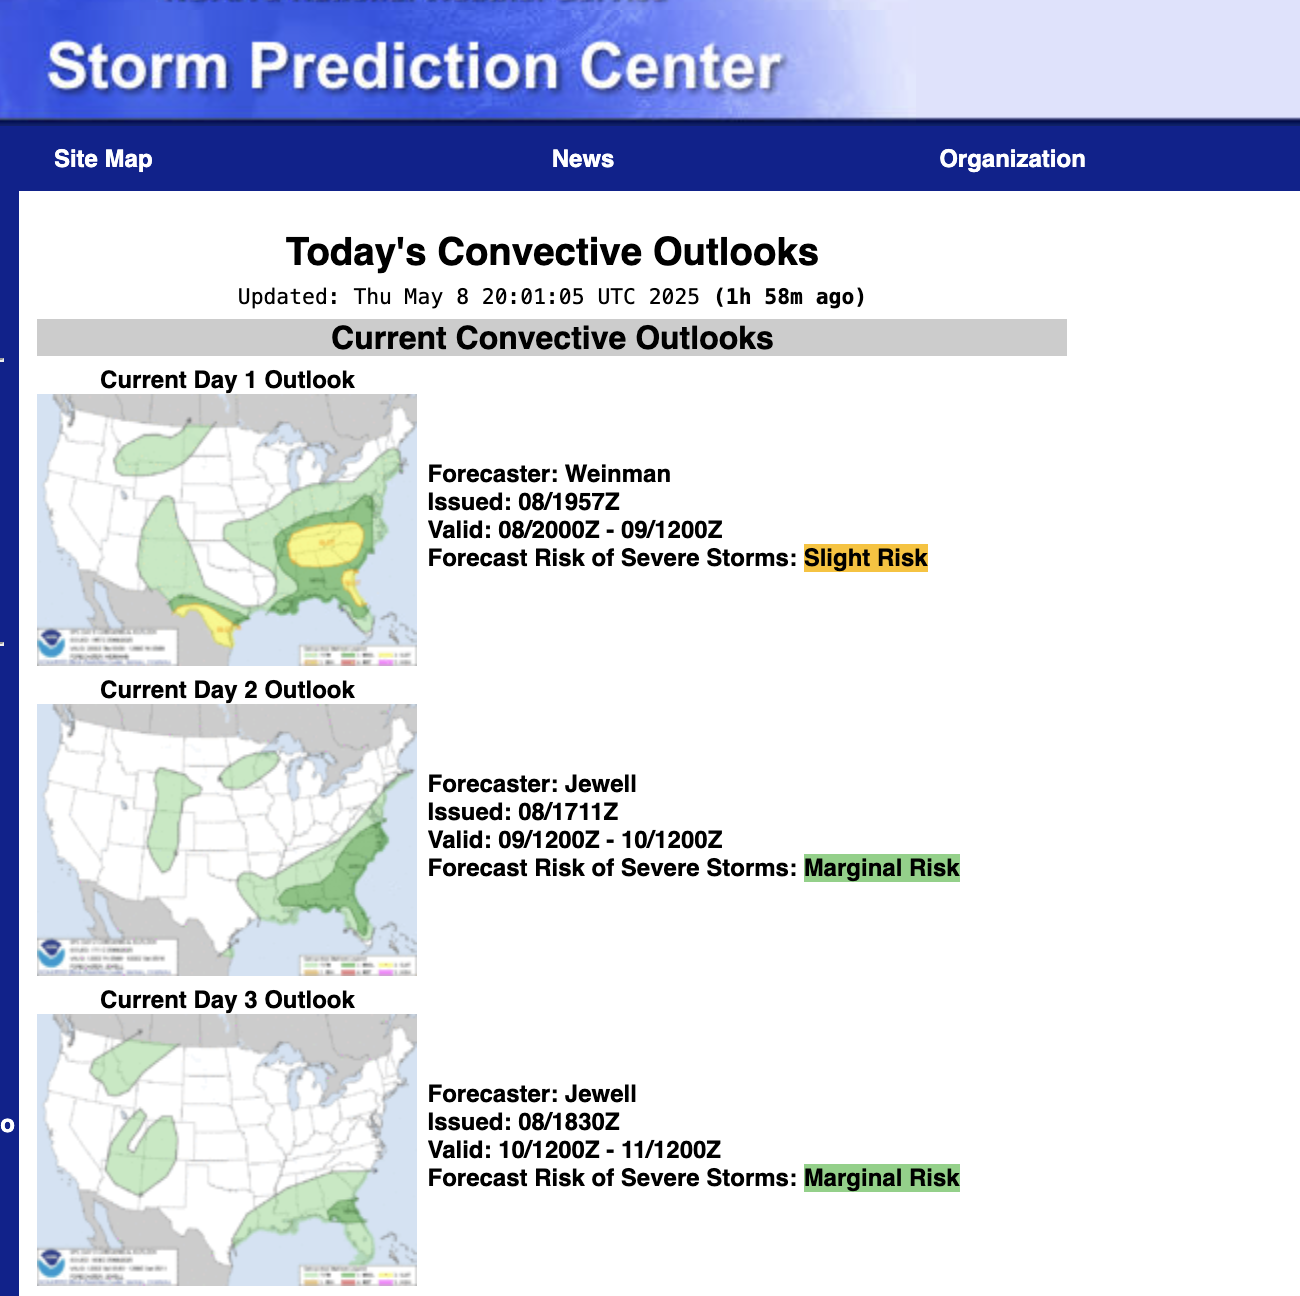
SPC Severe Weather Outlook (Days 1-8)
View the current (Day 1) and upcoming severe weather forecasts from the Storm Prediction Center. These forecasts convey the probability of observing severe wind, hail, or tornadoes at a given location on the map.
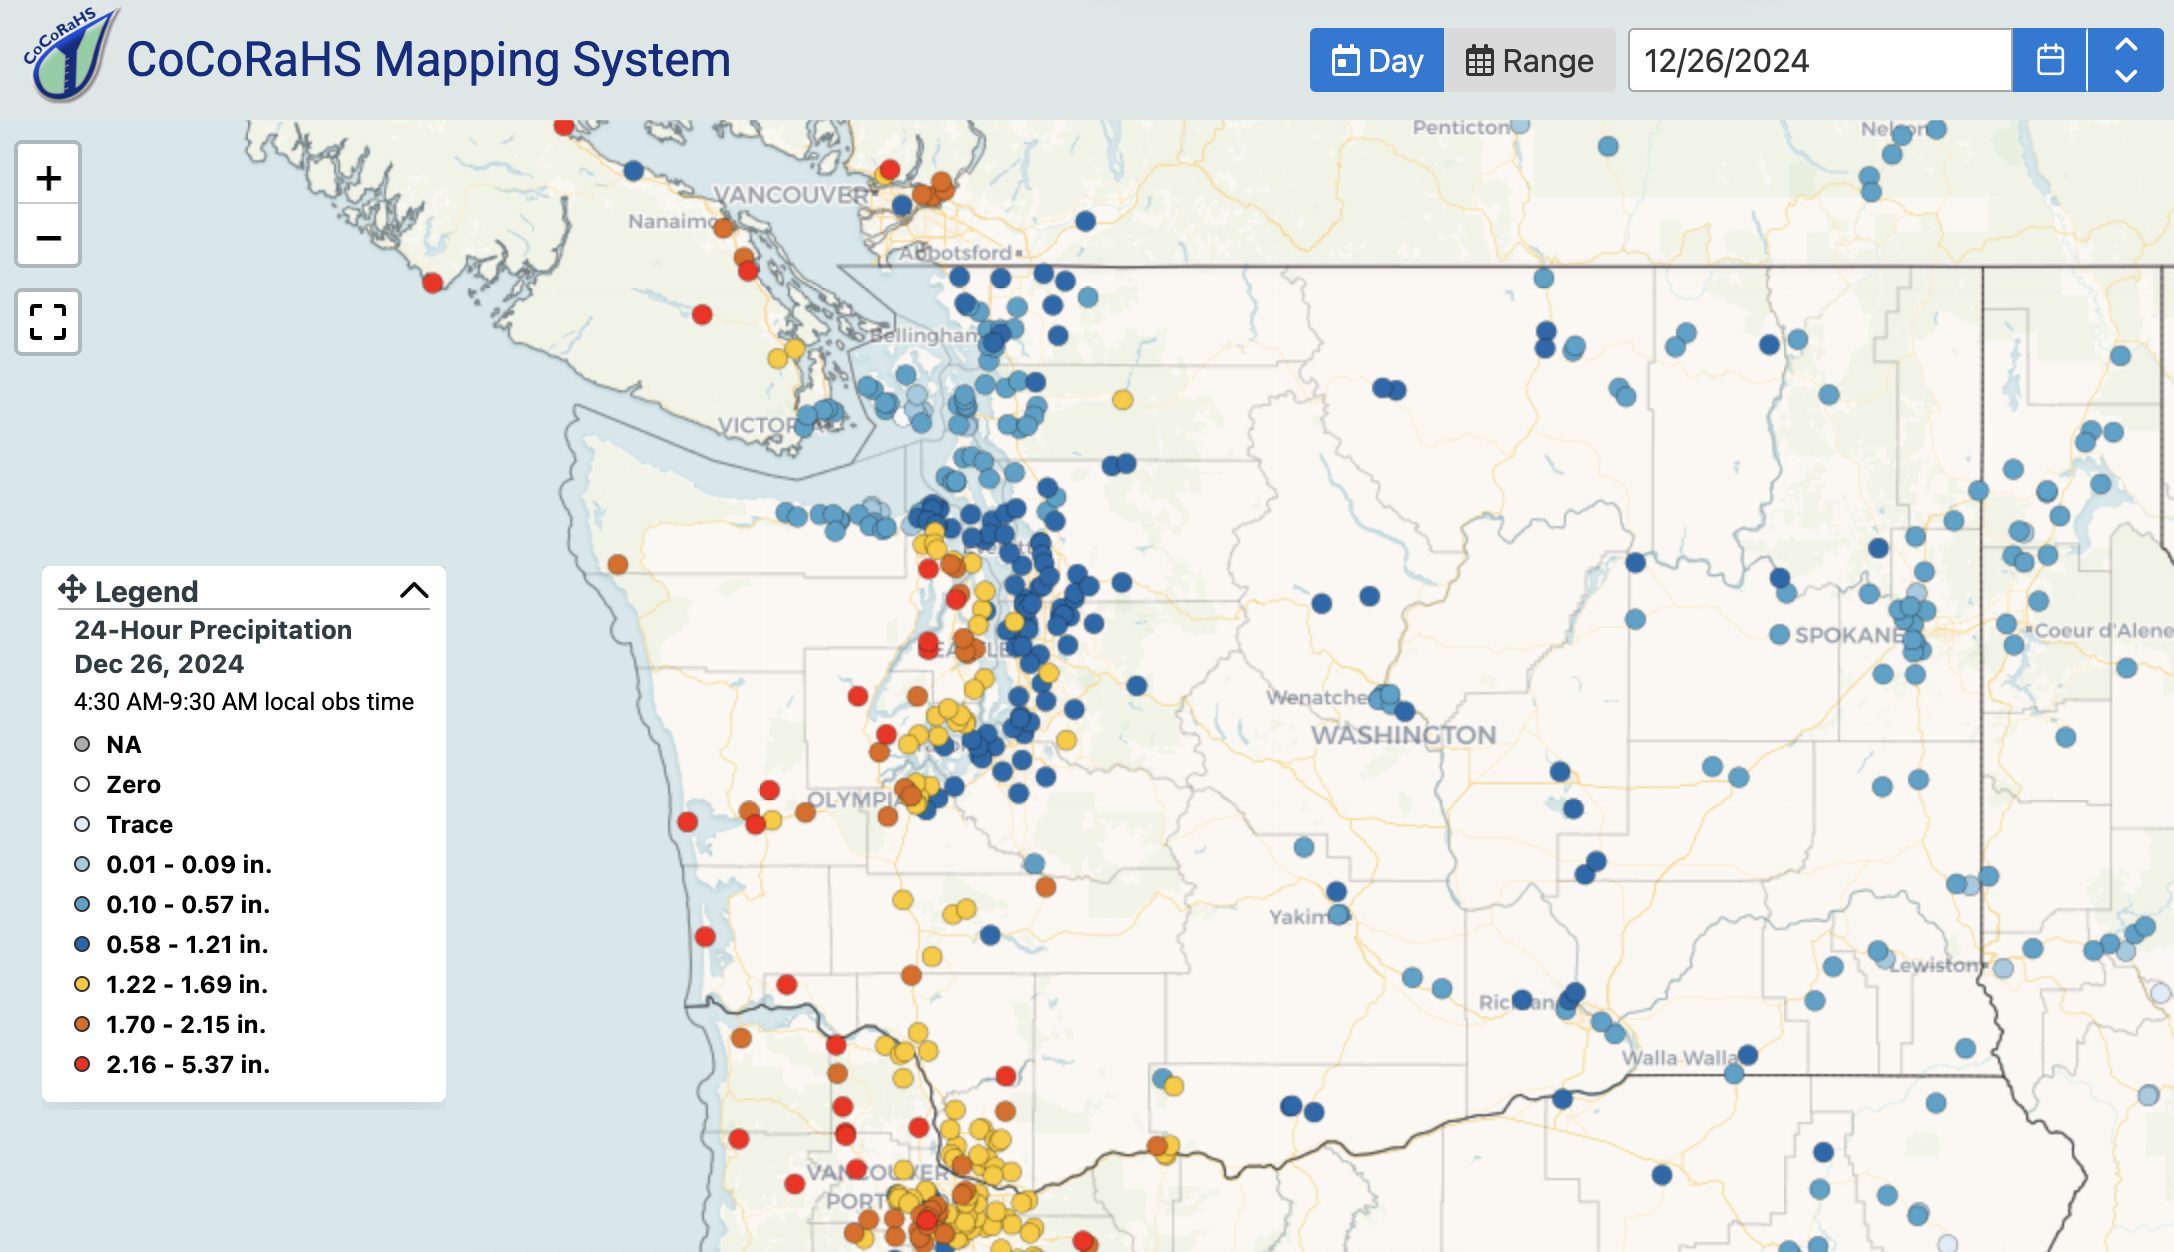
Community Collaborative Rain, Hail, and Snow Network (CoCoRaHS)
View a map of daily precipitation, snowfall, and snow depth measurements from a large and growing network of backyard weather stations. Observers began taking measurements in WA state in June of 2008, and observations are updated daily.
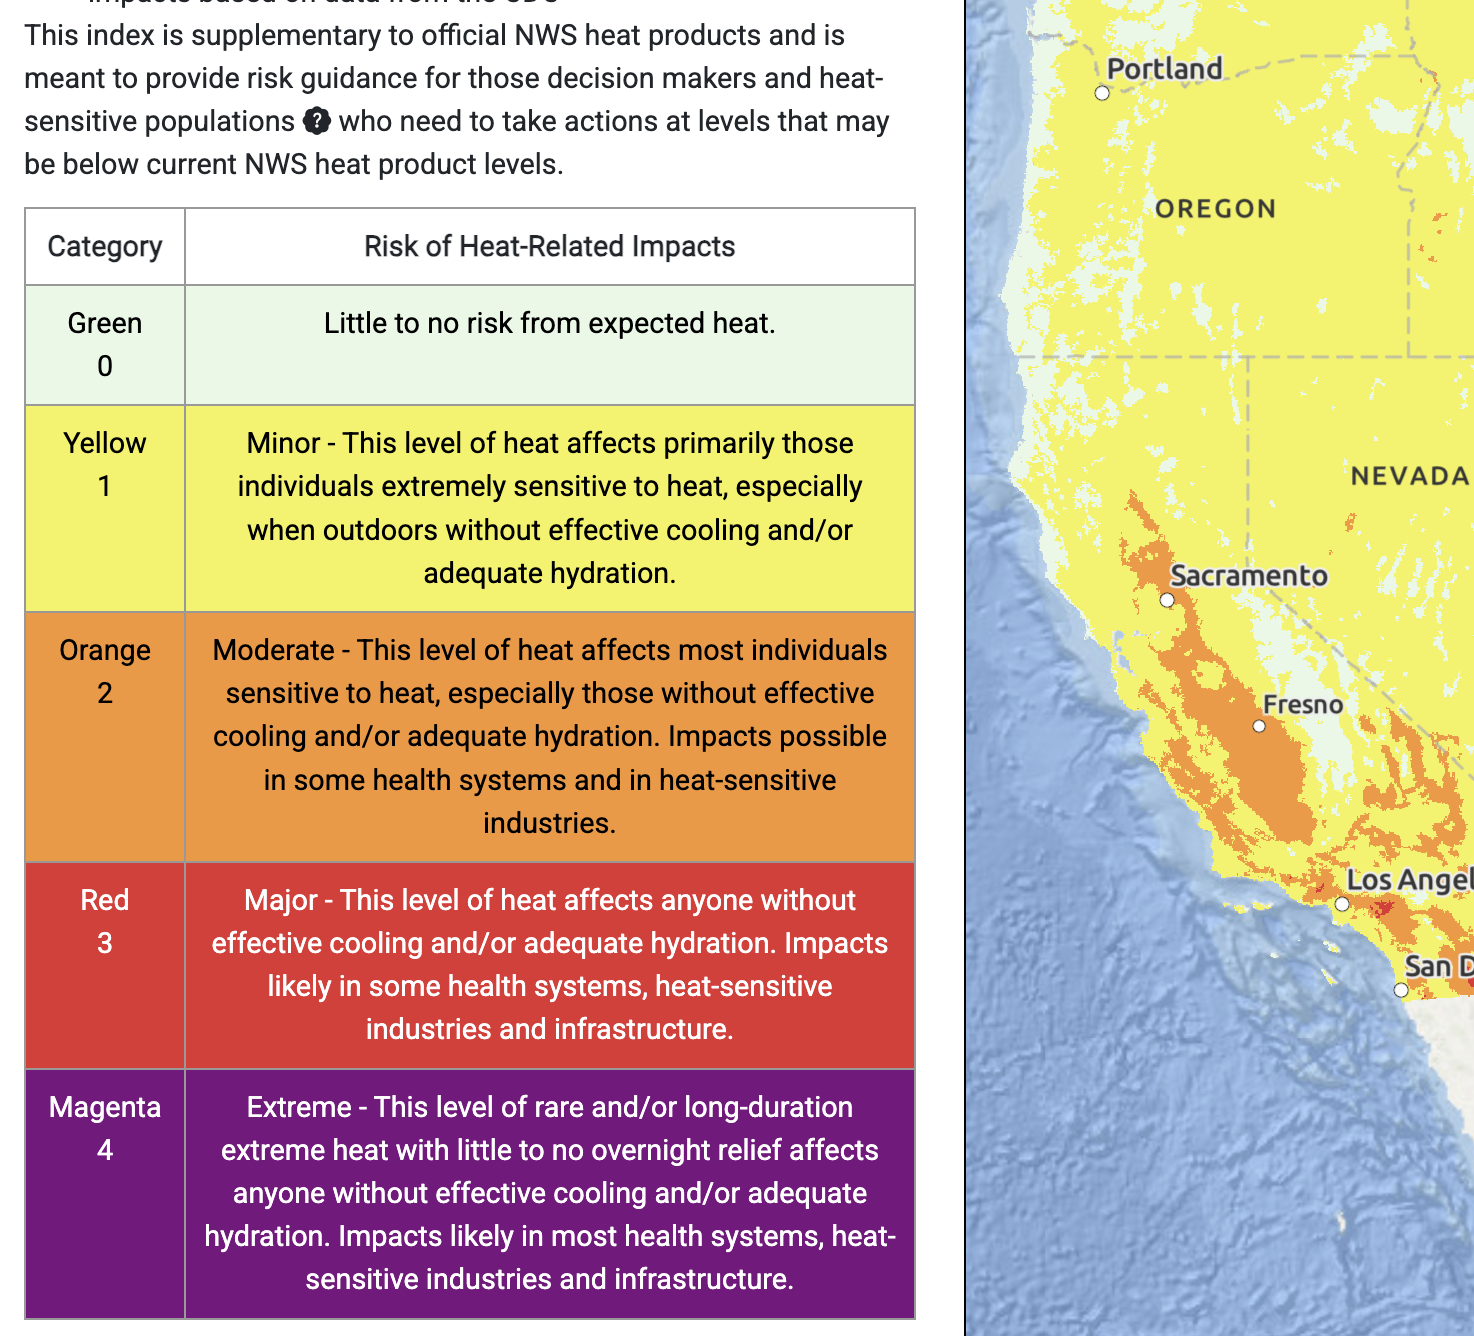
NOAA HeatRisk Tool
View impacts-focused forecast maps of heat risk out to 7 days from the present. This tool is meant for use primarily by decision makers and emergency managers.
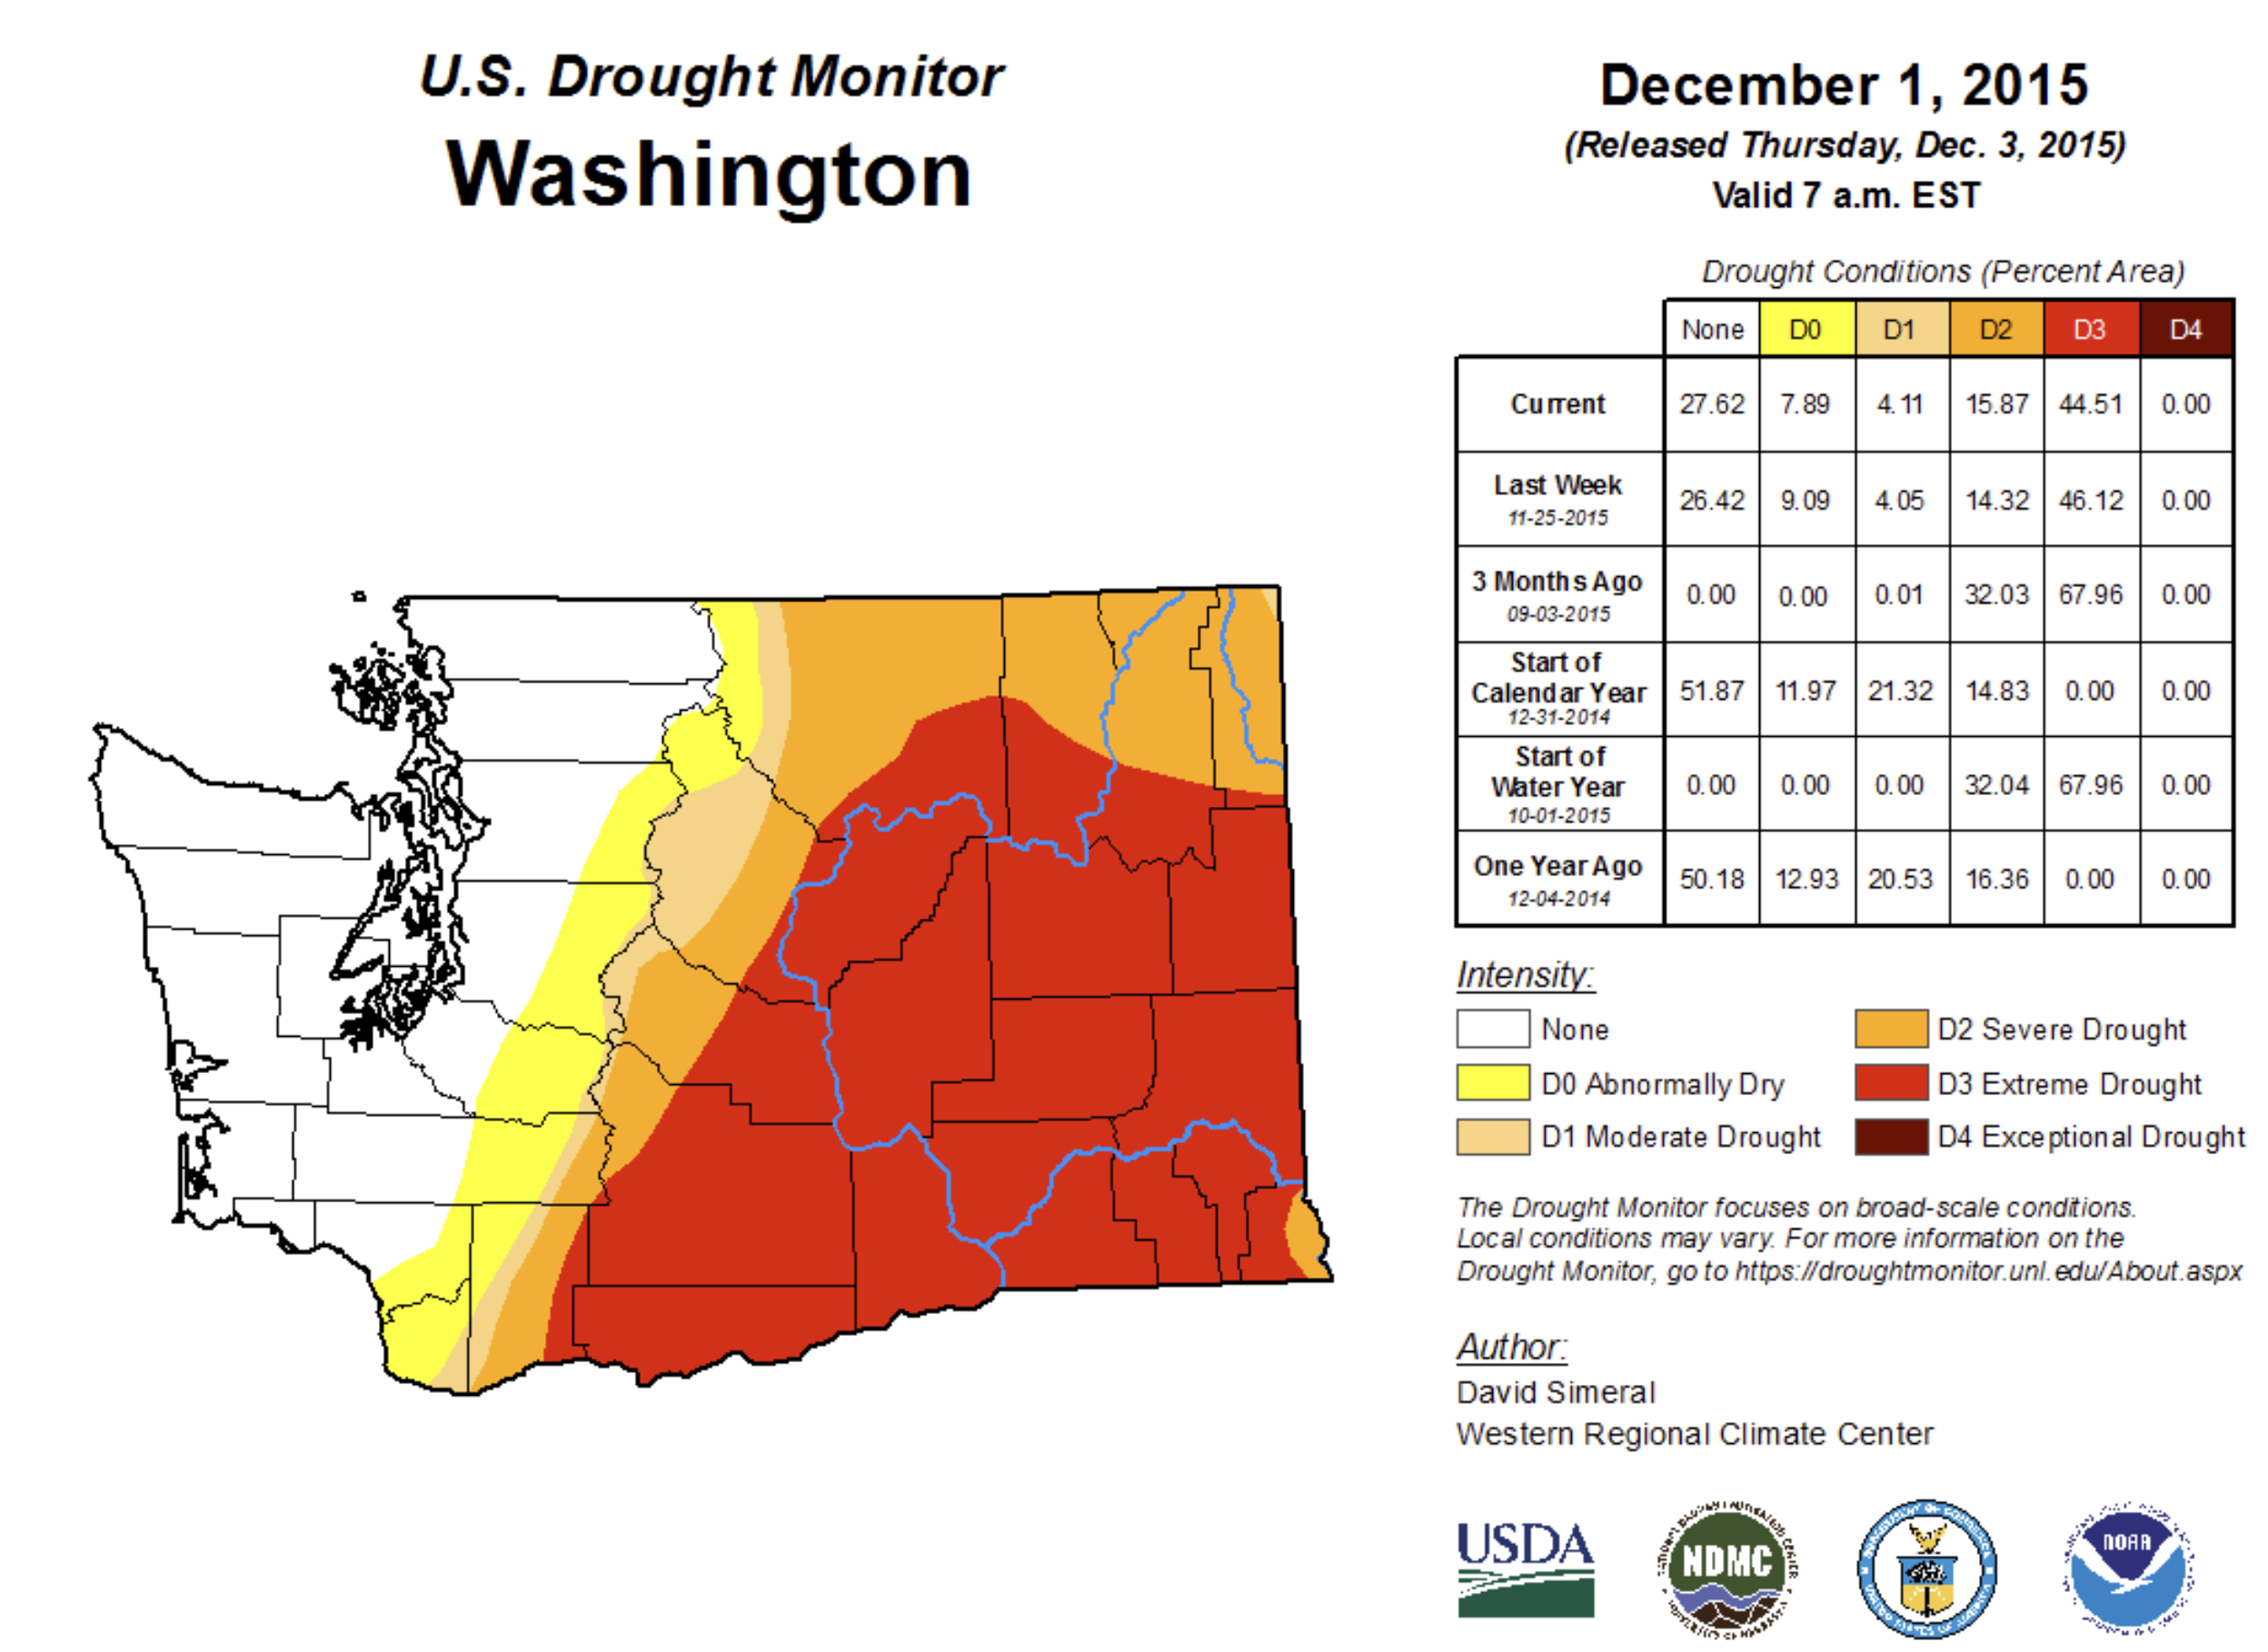
U.S. Drought Monitor
A weekly map synthesis of various drought indicators to classify drought into different percentile categories from 2000-present. Also view seasonal outlooks using the “Conditions & Outlooks” tab.
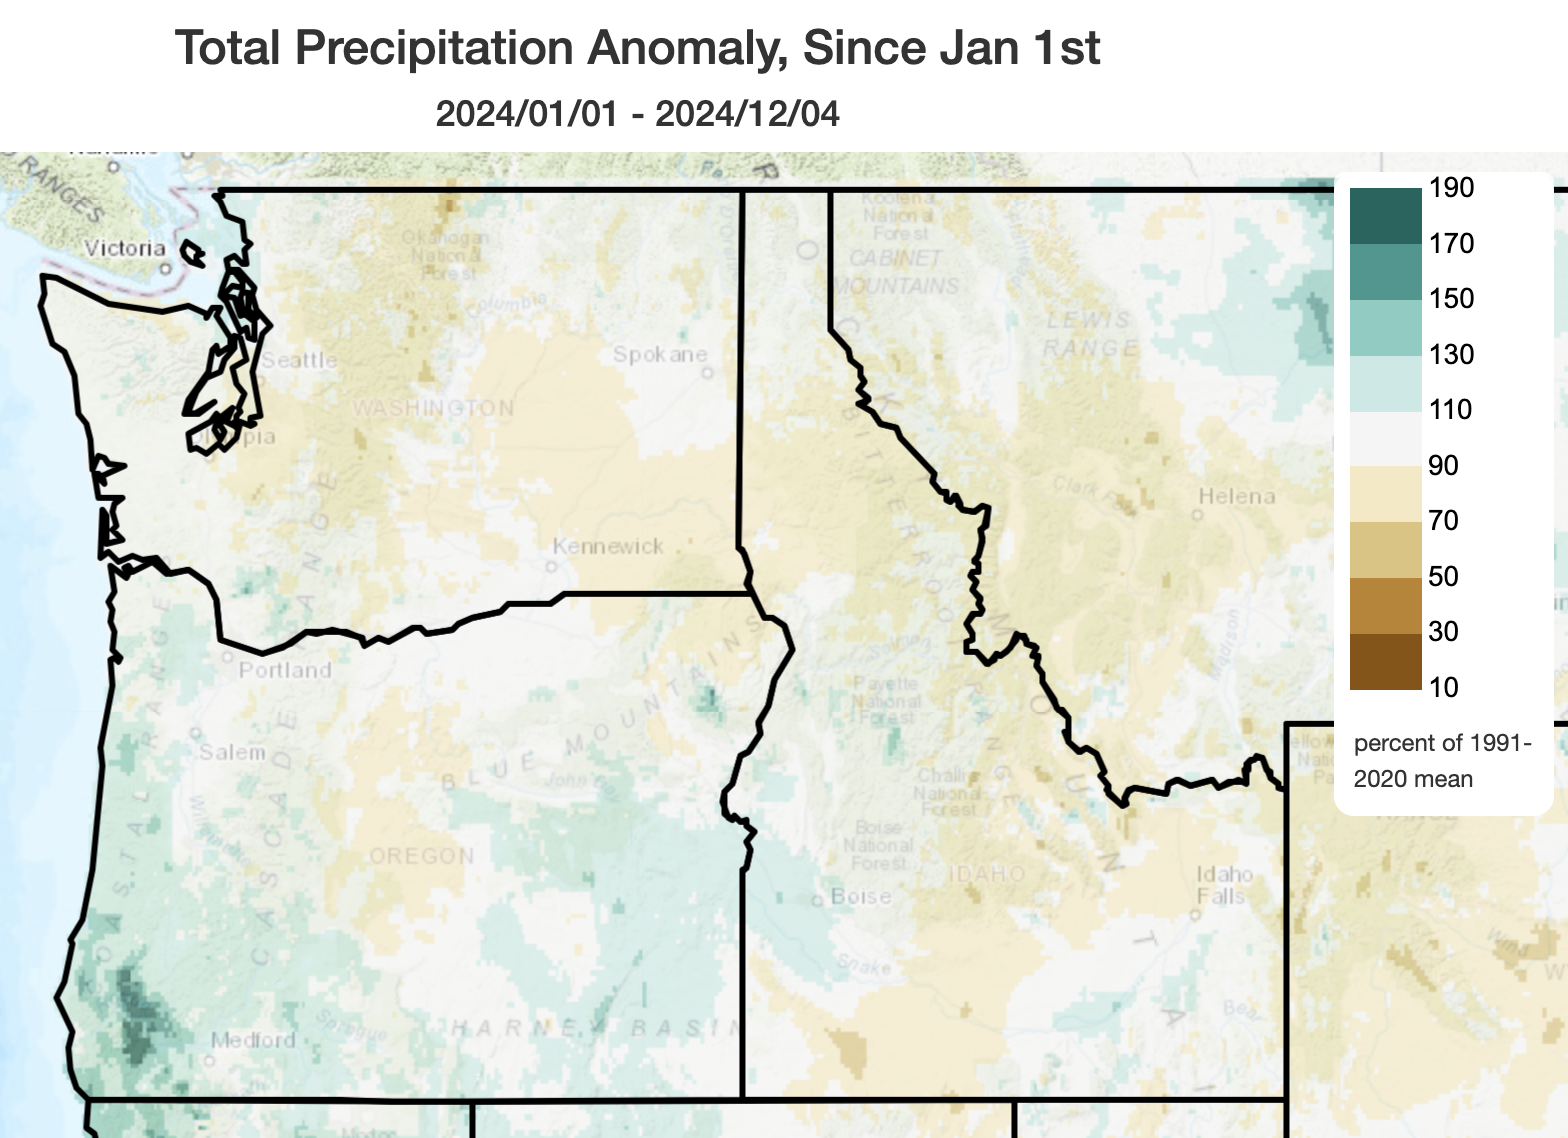
Climate Toolbox Climate Mapper
Maps of recent, gridded conditions, as well as monthly and seasonal forecasts and long term climate projections on a seasonal and annual time scale.
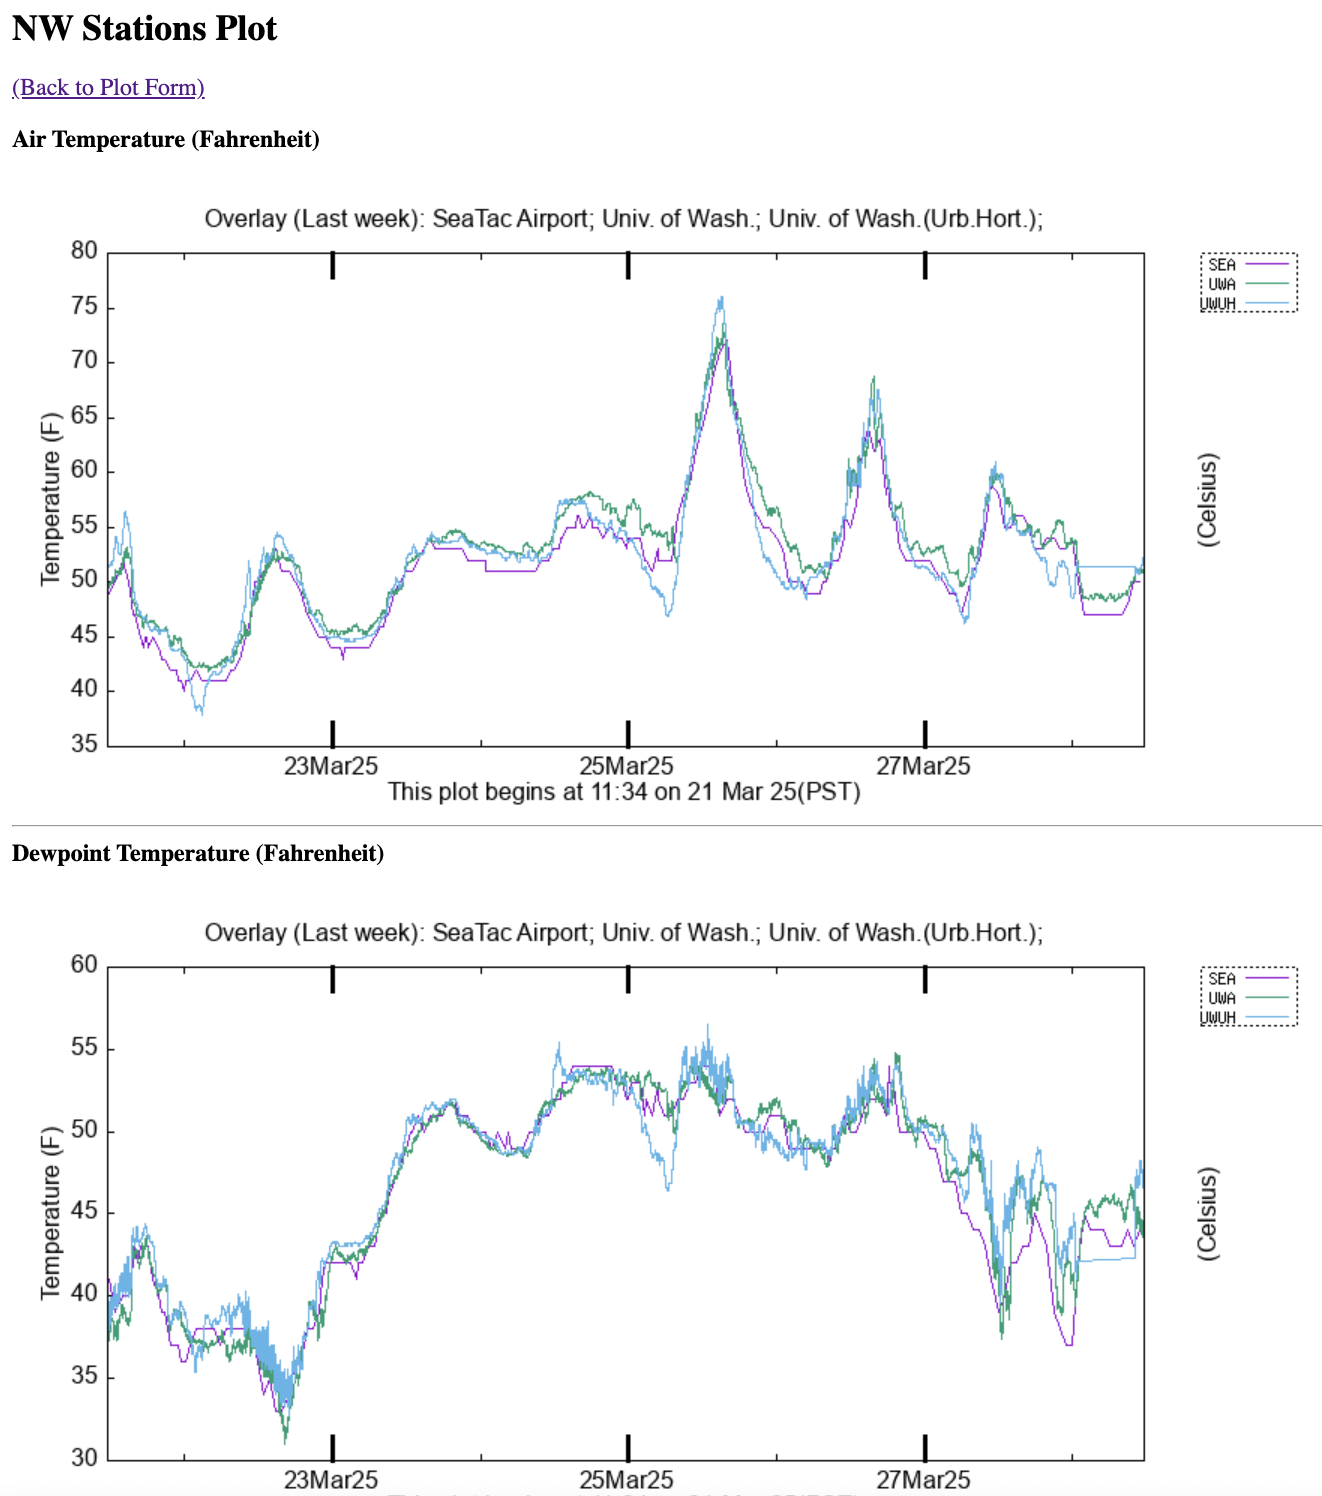
UW Atmos Recent Timeseries Weather Observations across the NW
Plot real-time and historical weather conditions for various stations in WA, OR, ID, and BC. Data are available from 1996-present.
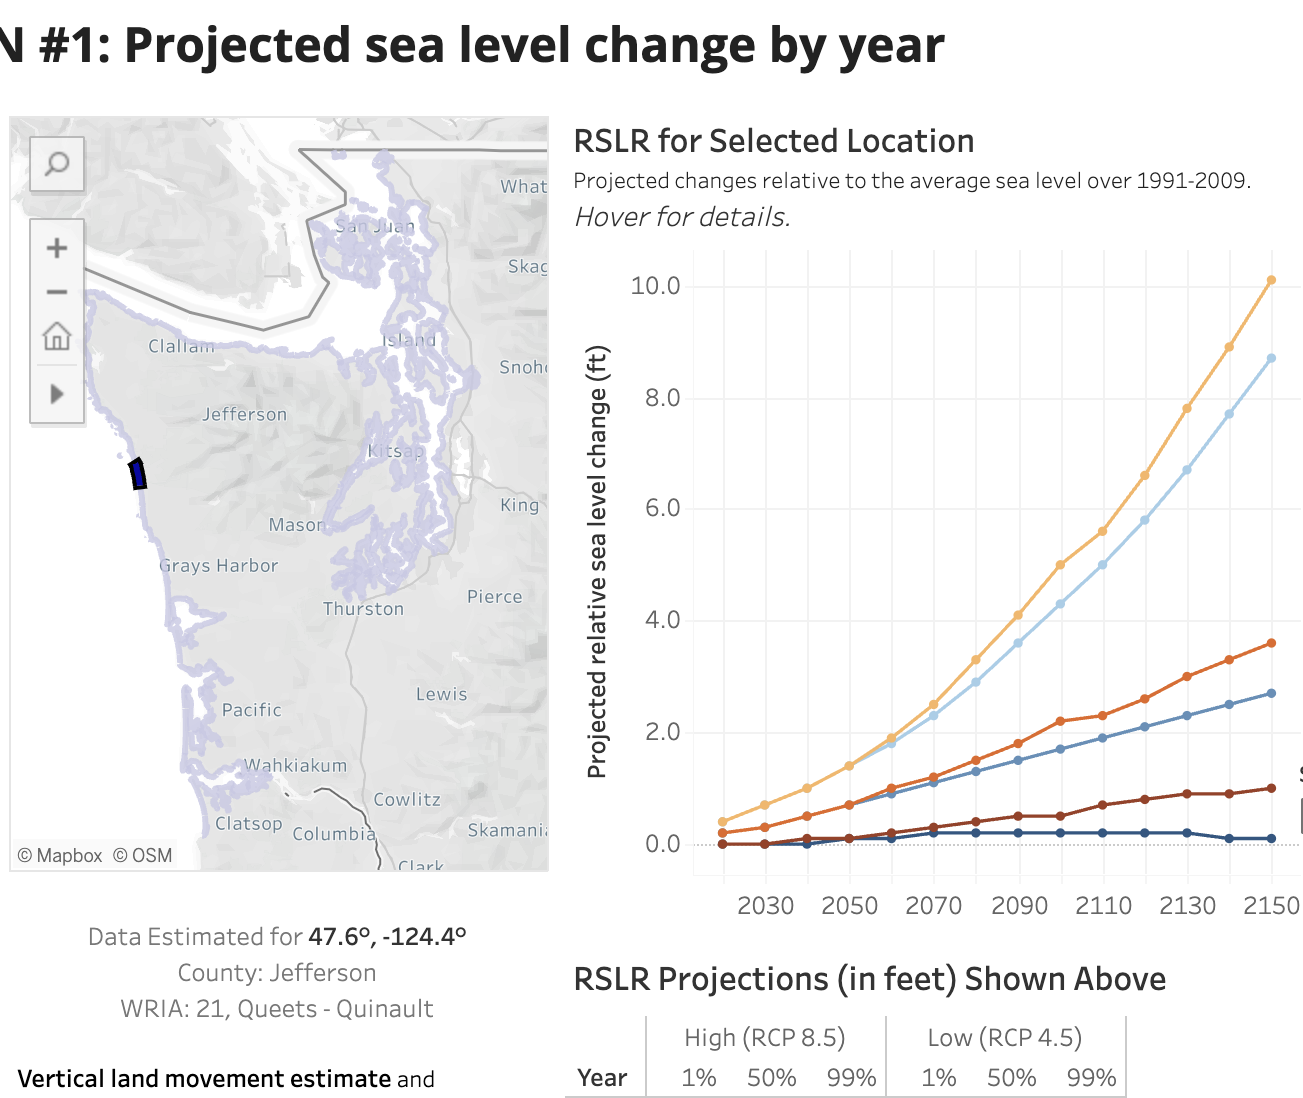
CIG Probabilistic SLR Tool
View maps and graphs of projected sea level rise on Washington shorelines out to the year 2150. This tool takes into account gradual land subsidence/uplift.
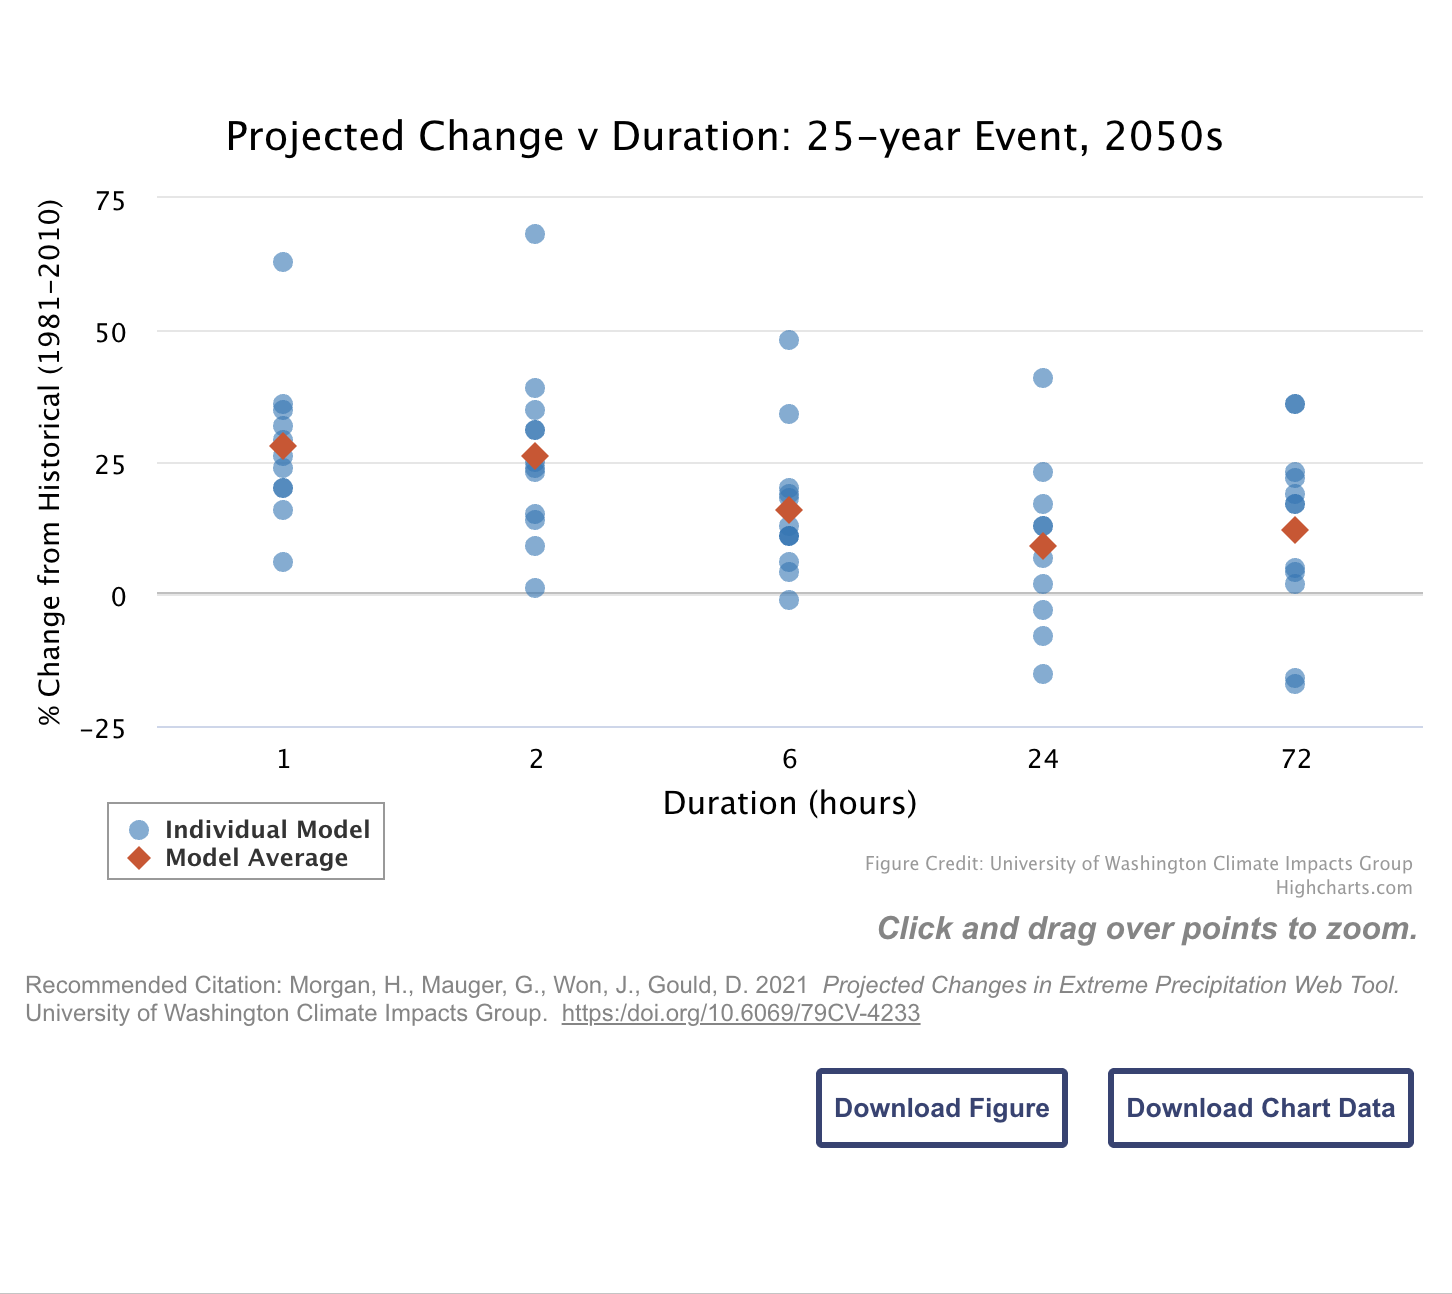
CIG Extreme Precipitation Tool
View projected changes in extreme precipitation metrics across the northwestern contiguous US and far southern B.C. Projections are available for different rainfall event durations (from 1 to 72 hours) and return intervals (from 2 to 100 years).
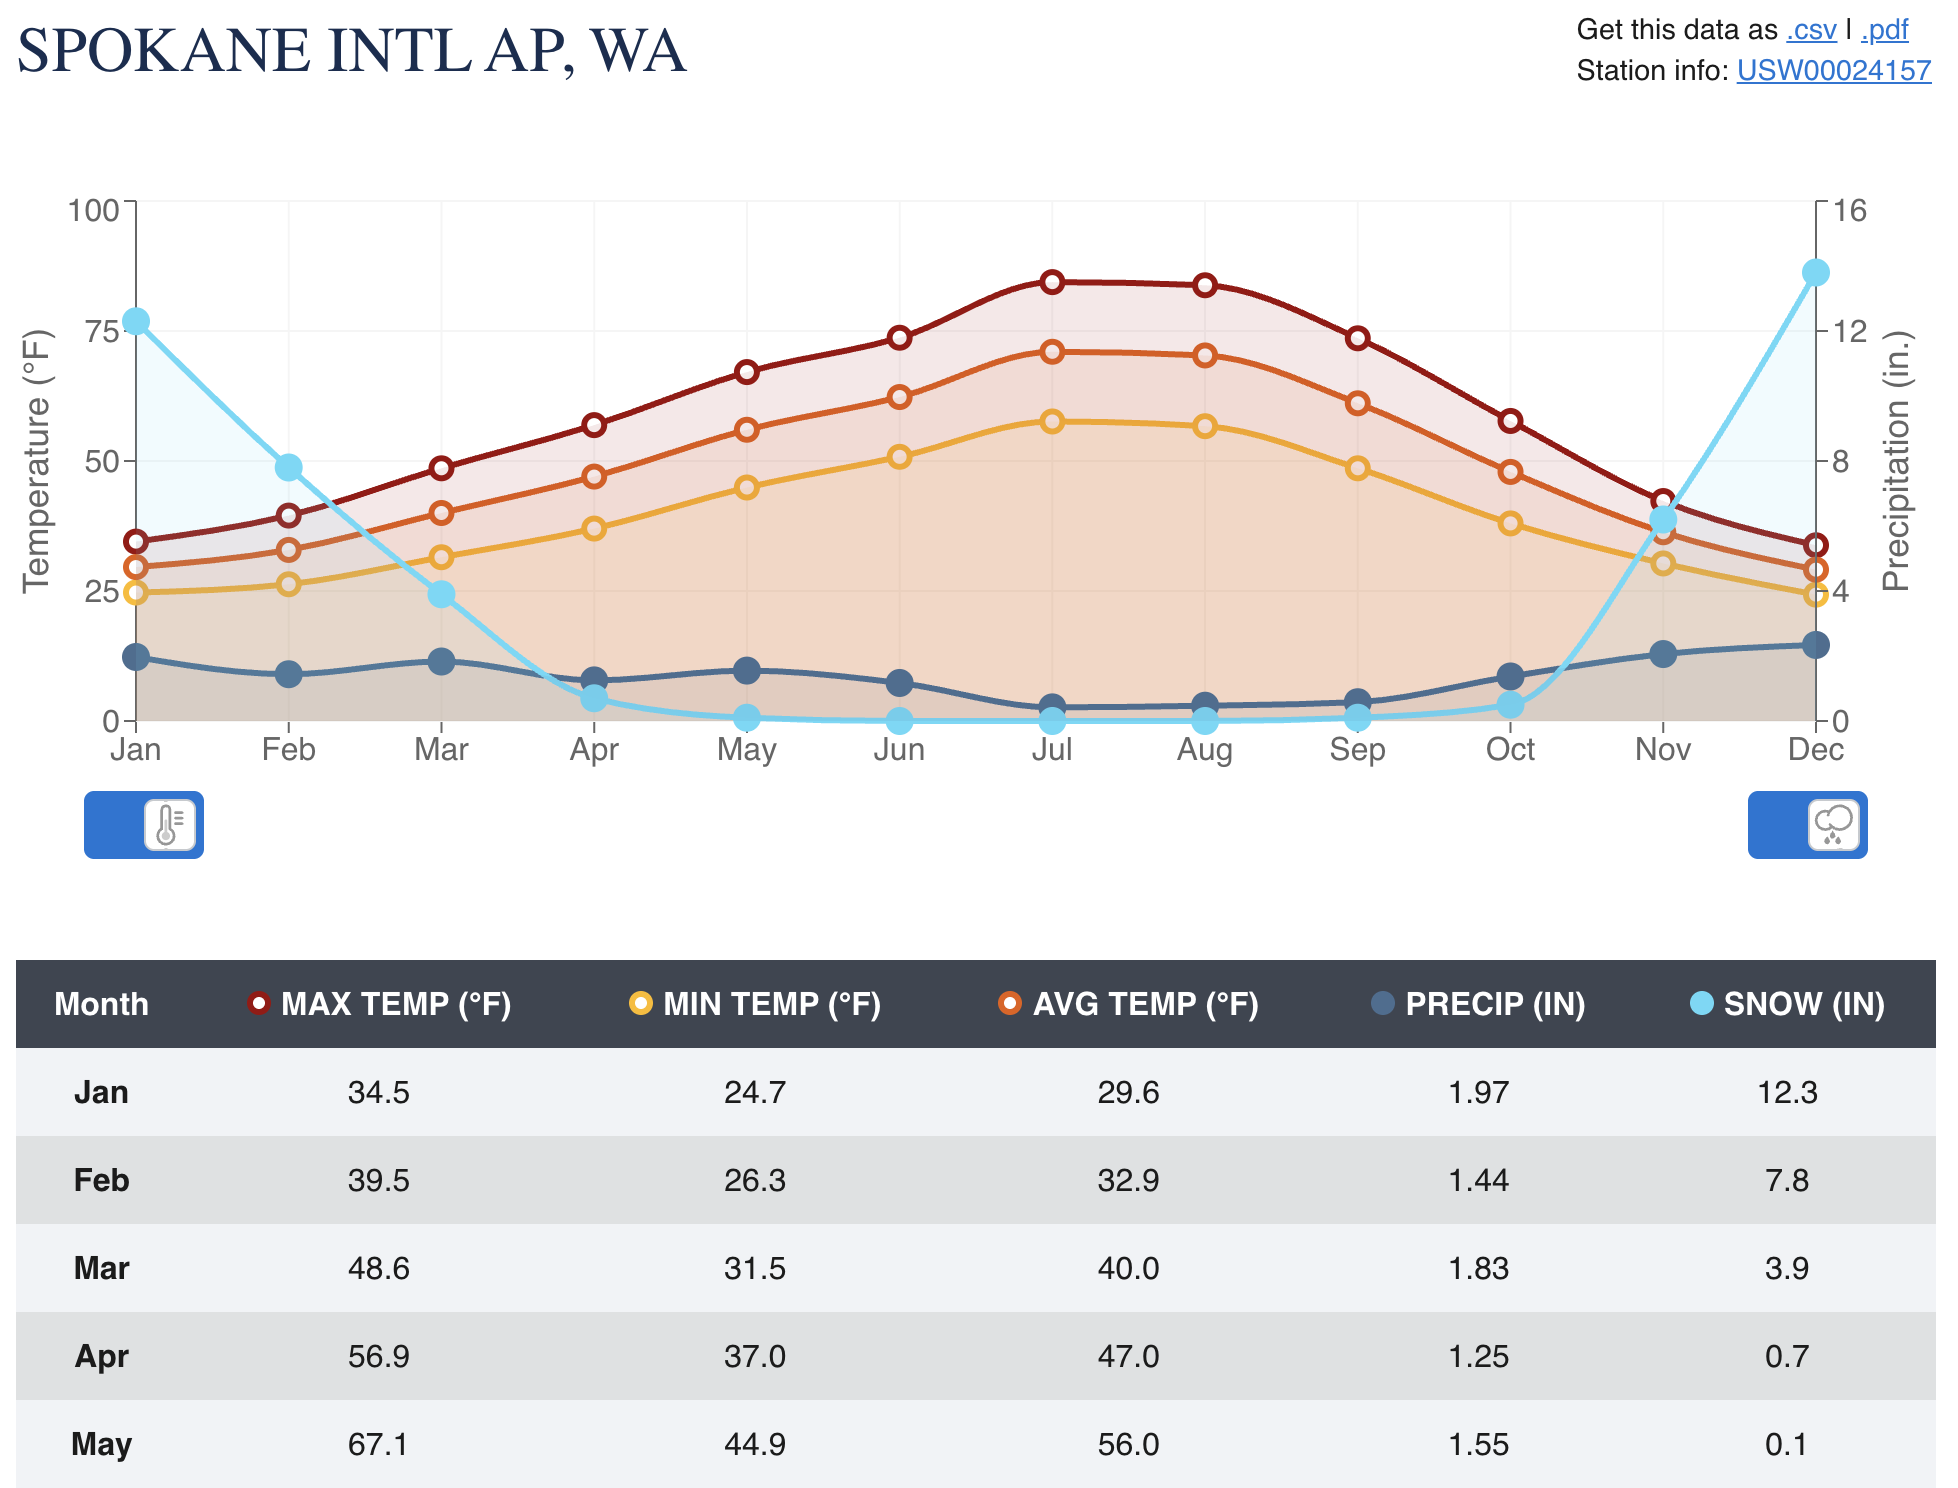
NCEI Climate Normals Viewer
View graphs and download data for annual, seasonal, monthly, daily, and hourly normals for temperature, precipitation, and snowfall from climate stations nationwide. Climate periods available for graphing and download include 2006-2020, 1991-2020, and 1981-2010.
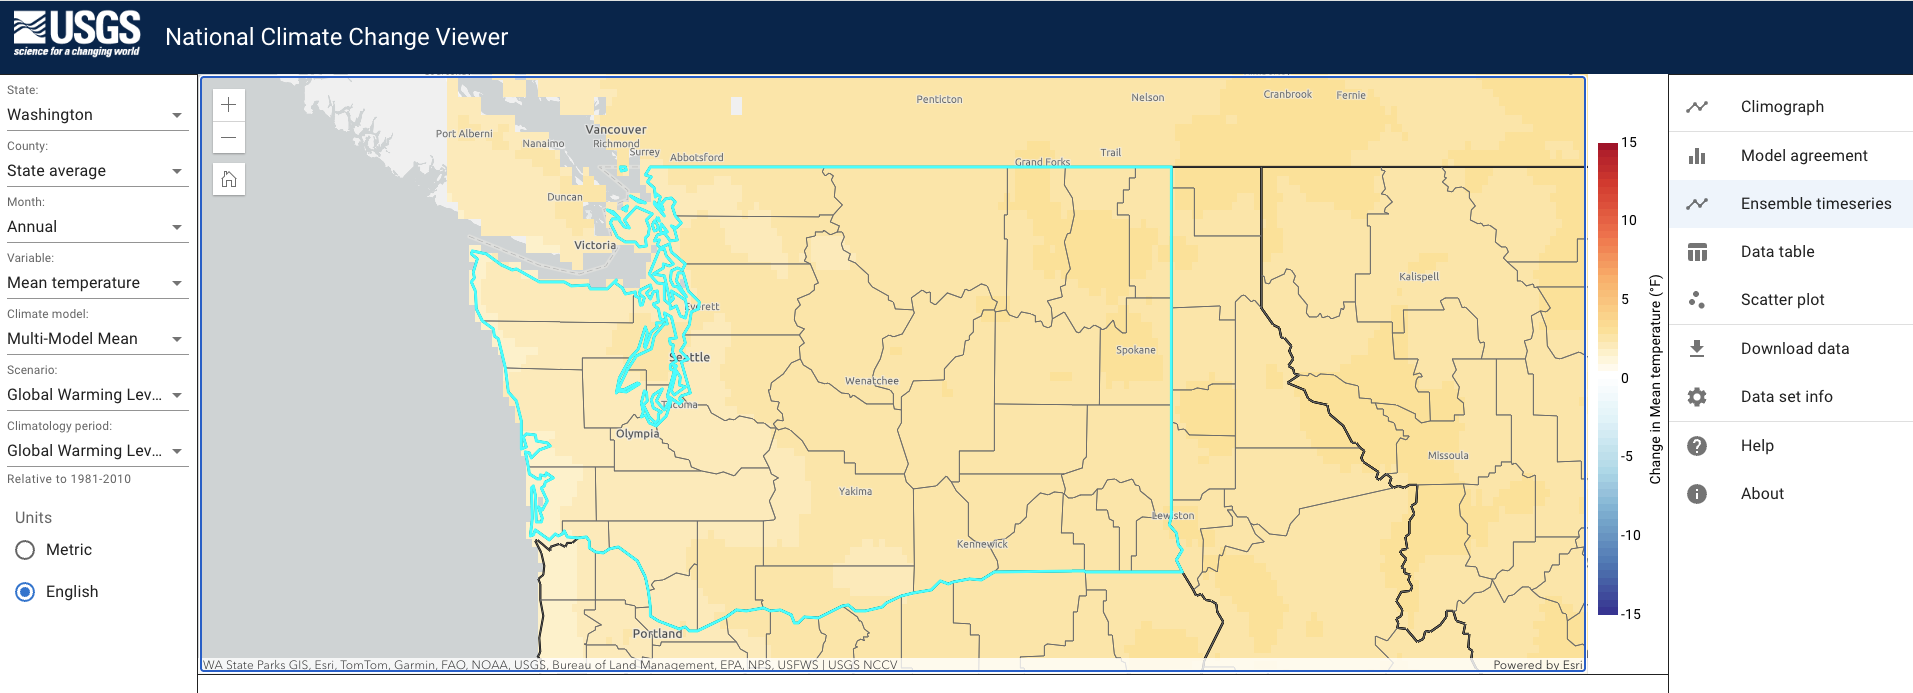
USGS National Climate Change Viewer: CMIP6-LOCA2
View gridded historical and projected (1950-2100) daily minimum temperature, maximum temperature, and precipitation across North America from the LOCA2 dataset. Future projections are available for various emissions pathways (SSPs) and global warming levels using CMIP6 data.
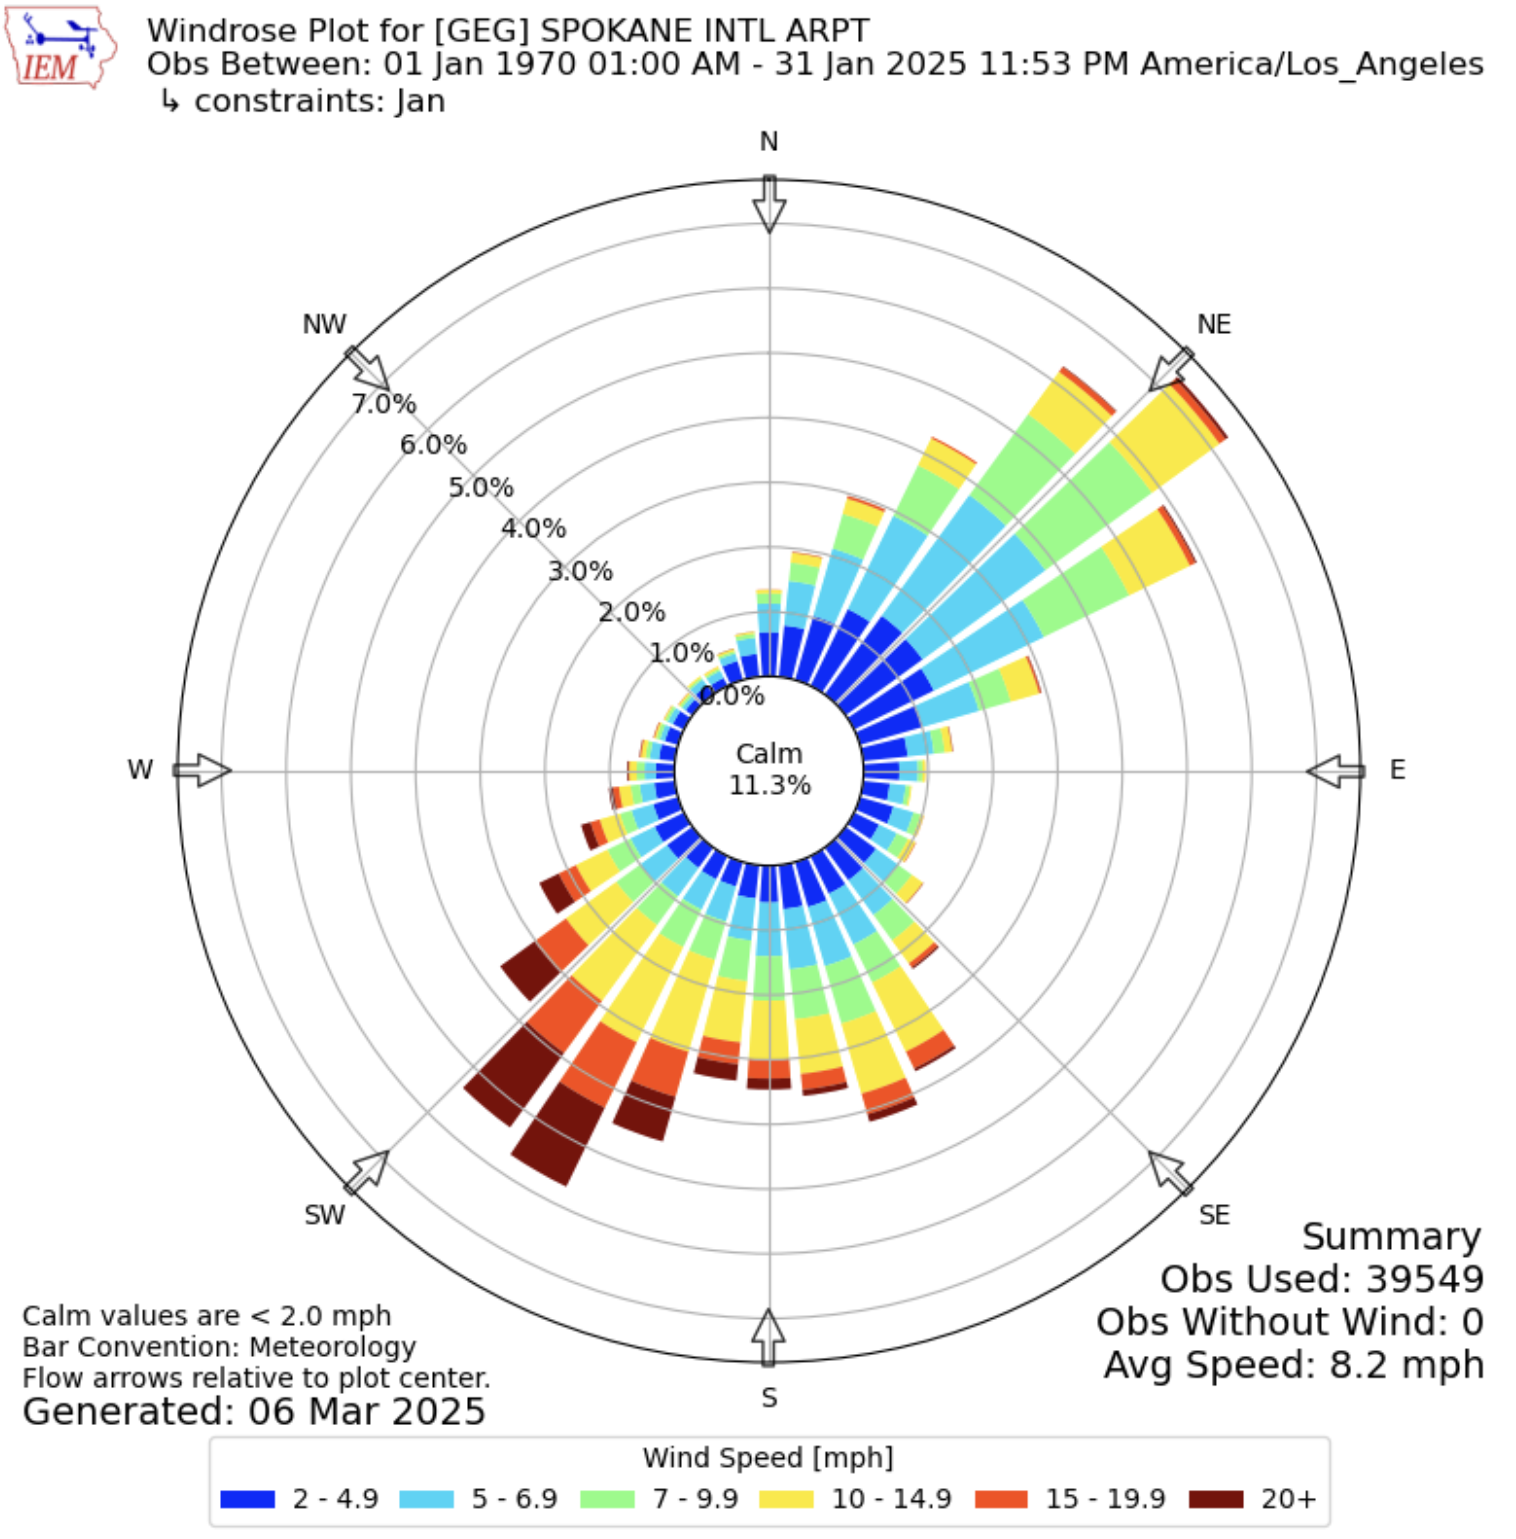
Wind Rose Diagrams
View monthly wind roses (diagrams showing the frequency of average wind direction and speed at a given location) for ASOS (airport) stations across Washington State. This tool also allows the user to download raw data and choose a custom time period to plot as well.
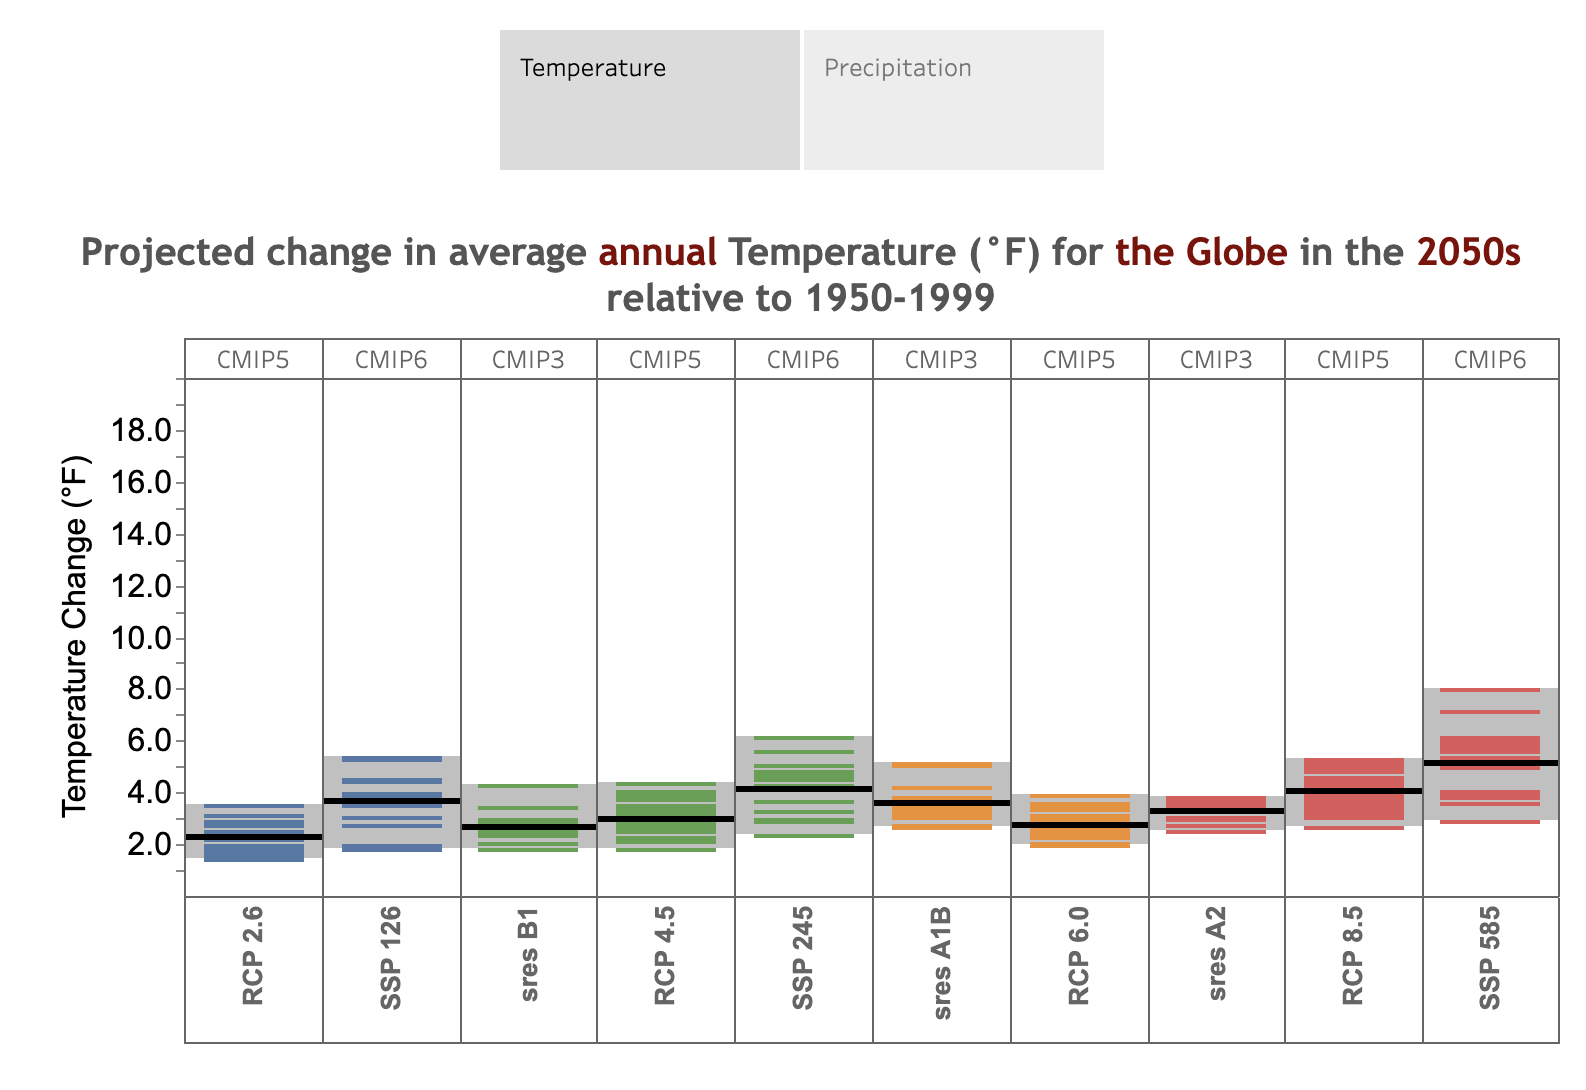
CIG PNW Climate Projections Tool
Explore various climate model projections from different CMIP experiments of annual and seasonal temperature and precipitation. Data is available for the 2050s and 2080s relative to 1950-1999 averages.