By Karin Bumbaco
It has long been a vision of OWSC to feature a 10- part “Climate Division of WA” series in our newsletter, describing the climate of the 10 NOAA Climate Divisions, individually. This is the first in such series, and we expect to have intermittent installments for the remaining climate divisions over the next few years. We start, appropriately, with Climate Division 1 – the West Olympic Coast Climate Division. This division covers the entire WA coast to the west and southwest side of the Olympic Mountains (Figure 1), ranging in elevation from sea level to 7969’ on Mount Olympus, the tallest peak in the Olympic Mountains. The heavily forested climate division includes much of Olympic National Forest and Quinault Lake, Wynoochee Lake, and Lake Cushman, but splits Lake Crescent, only including the western half. It also contains the towns and reservations of Neah Bay, Forks, Quinault, Moclips, Hoquiam/Aberdeen, Ocean Shores, Montesano, and Long Beach.
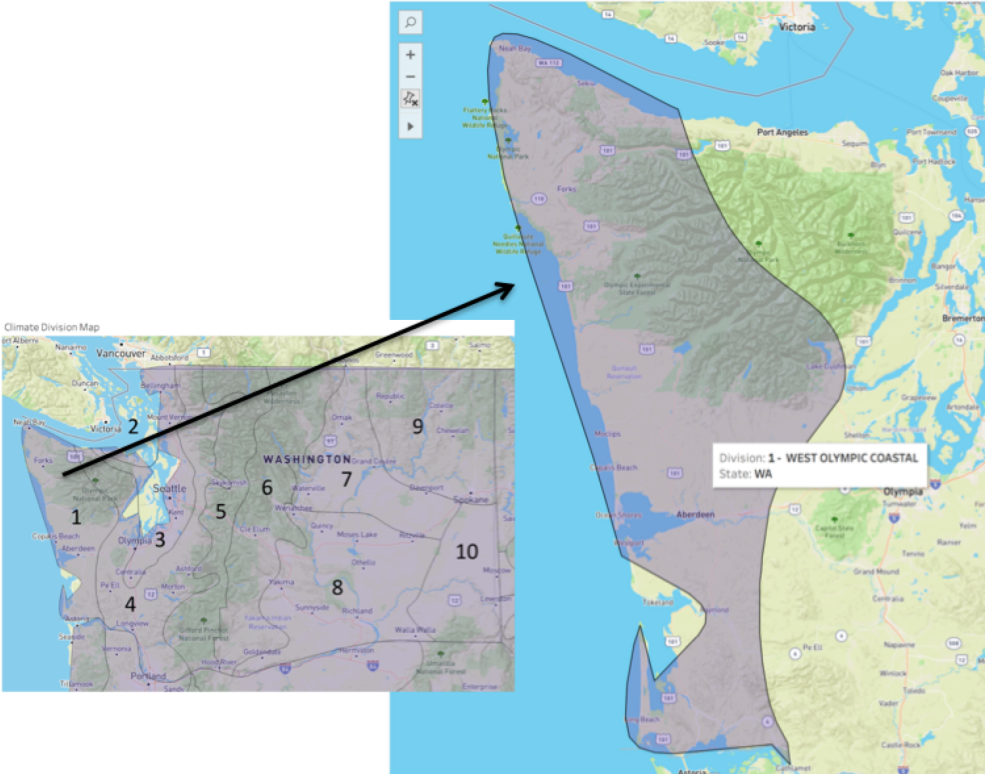 Figure 1: Climate Division 1 – the West Olympic Coast – overlaid onto a topographical map. The purple polygon follows a rough coastline but should encompass the entire coast.
Figure 2 illustrates the monthly total precipitation, and maximum and minimum temperatures averaged over the climate division for 1981-2010. Annual precipitation for this division totals a staggering 108” (9 feet), ranking the West Olympic Coast division as the wettest in the contiguous US by a comfortable margin. But even with large annual precipitation total, the coastal division still experiences a marked seasonality in its precipitation, with July and August on average receiving only about 2”. November is the wettest month, with about 18” in the mean. With regards to temperature, August is the warmest month with maximum temperatures at about 70°F and minimum temperatures at about 50°F. December is the coldest month, but the temperatures are still relatively mild with the average minimum temperature just above freezing (32.7°F).
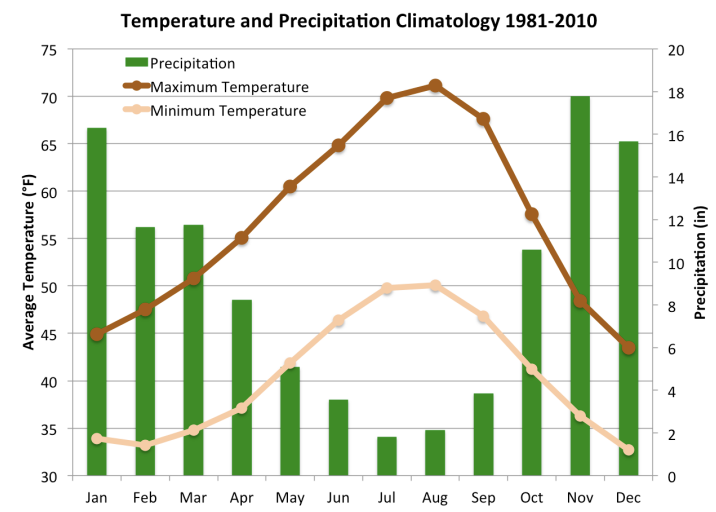 Figure 2: Monthly maximum temperature (°F), minimum temperature (°F), and total precipitation (inches) climatology for the 1981-2010 period for Climate Division 1.
Extremes in this climate division are perhaps more interesting, however, and we used the monthly climate division data to tabulate the warmest, coldest, wettest, and driest months since the record began in 1895 (Table 1). The warmest (July 1958) and coldest (Jan 1950) months are extreme months for the state overall. The cold anomaly is impressive in terms of its magnitude, 14.2°F colder than the 1981-2010 normal. Two months tied for the most precipitation – Dec 1933 and Jan 1953 – with nearly 38” in a month, 22” above normal. The entry for the driest month of July 1922 has a total precipitation of zero; we confirmed that several stations that were reporting that early in the record recorded no measurable precipitation. Seasonal wind rose charts for Quillayute Airport are shown here as an example of the wind climatology for the climate division (Figure 3). Light winds from the northeast are prominent in fall, winter, and spring, and are likely a result of drainage from locally higher terrain to the northeast of this particular station. The strongest winds during those same seasons are from the south or southeast due to the regional effects of the Olympic Mountains as fronts and low pressure systems approach the coast. During summer, the ridge of high pressure that persists off the WA coast results in light northwesterly, westerly, or southwesterly winds. Regardless of the season, the coastal division, which is not necessarily well- represented by the Quillayute station, often includes an onshore component to the low-level flow due to the prevailing large-scale atmospheric circulation.
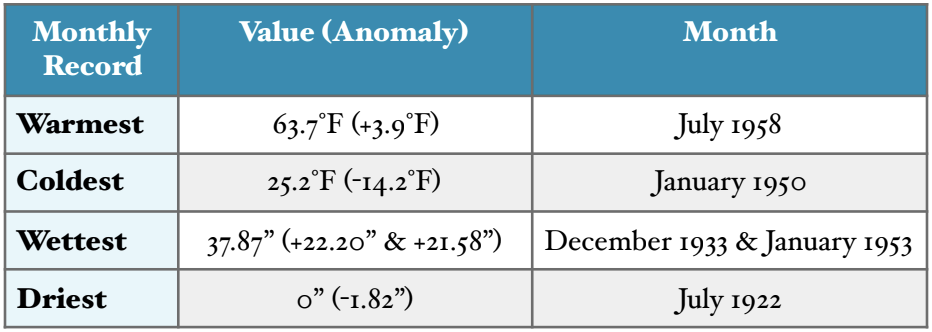 Table 1: The warmest, coldest, wettest, and driest month for Climate Division 1 using the period of record (1895-2018).
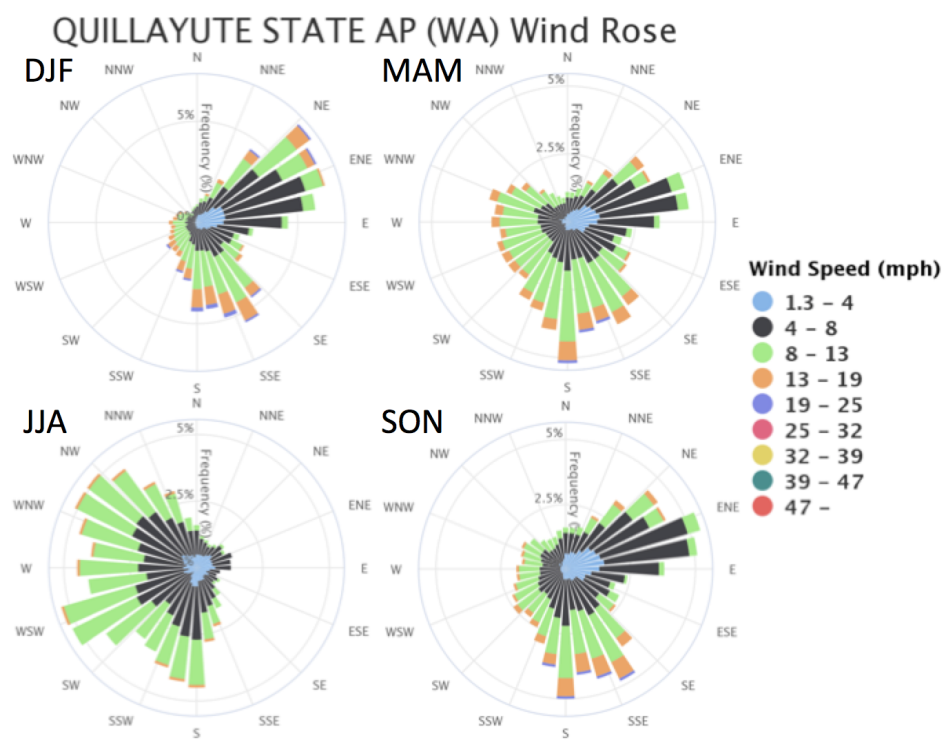 Figure 3: Quillayute Airport seasonal (DJF, MAM, JJA, SON) winds for the period of record (1966-2018) from MRCC’s CLIMate tool.
Time series of the annual average air temperature anomalies and total precipitation anomalies, using a long baseline of 1901-2000, for WA Climate Division 1 are plotted in Figure 4. For this figure, we define the 12-month averages based on the water year (October through September) rather than the calendar year. A time series of nearshore sea surface temperature (SST) anomalies for the area of 40-50°N, 135-125°W is also plotted. The precipitation record for the division includes some extended periods of relatively dry (for the region) and wet conditions and lots of year-to-year variability. The overall trend in annual total precipitation is negligible. The temperature record is more interesting.
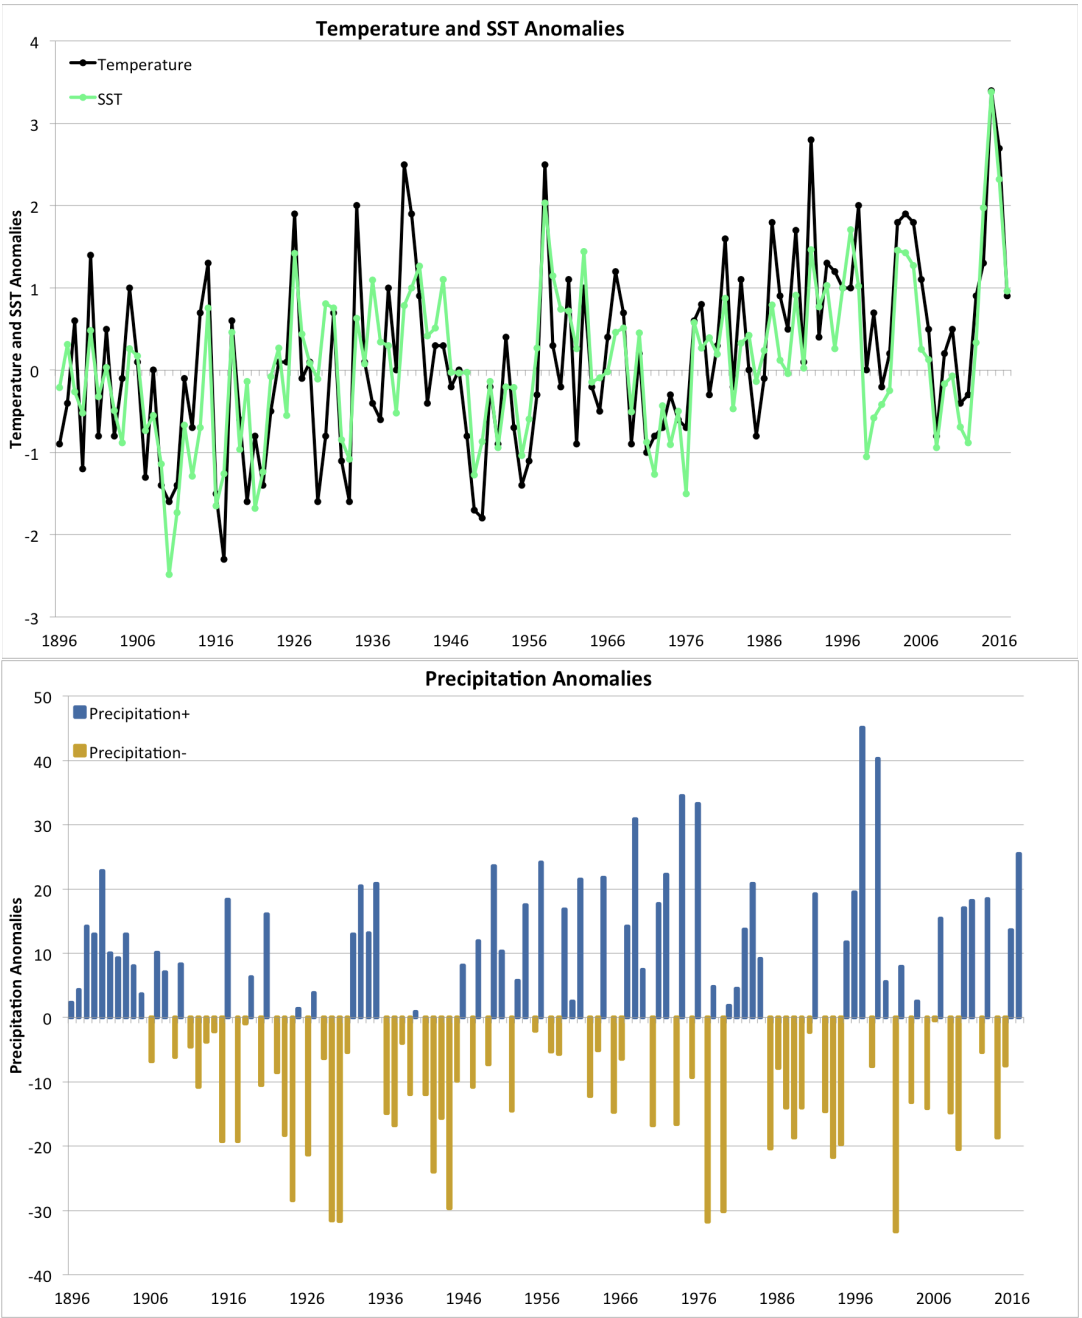 Figure 4: Climate division water year average temperature (top) and water year total precipitation (bottom) anomalies based on a 1901-2000 baseline for the period of record (1895-2017). Sea surface temperature anomalies from the Kaplan Extended V2 dataset of the WA coast are also included (top).
First and perhaps foremost, the division air temperatures indicate an overall warming during the second half of the record after a more-or-less flat trend during the first half. Another way of looking at it is that during recent decades, the cool years are relatively rare, and of modest intensity (less than 1°F colder than normal) compared with their counterparts earlier in the record. There is essentially no relationship between the interannual fluctuations in the air temperatures and total precipitation amounts.
On the other hand, we are impressed by the strength of the correspondence between the air temperatures and regional mean SSTs. In more specific terms, the linear correlation coefficient between these two time series is about 0.8. Distinguishing between cause and effect can be tricky here in that the atmospheric circulation patterns that produce warmer ocean temperatures can also favor warmer weather. Nevertheless, this climate division’s air temperatures should be expected to be sensitive to the regional SST because the low-level winds often have an onshore-directed component. Because of the thermal inertia of the upper ocean, once substantial temperature anomalies are established they can persist for months. It turns out that the yearly values of precipitation are actually slightly negatively correlated (r ~ -0.2) with the regional SST. This result is consistent with the idea that the regional atmospheric circulation patterns that tend to cause elevated SSTs also suppress precipitation, at least in this particular climate division.
To summarize, WA’s West Olympic Coast climate division is the wettest in both the state and the continental US, yet still has a distinct seasonality of a dry and wet period. There is a relatively modest seasonal variation in temperatures, as might be expected for a region subject to maritime air masses. The low-level flow often has an onshore-directed component most of the year, but the strongest winds tend to be from the south. The most recent monthly extreme for the entire division was 60 years ago in July 1958, when the warmest month was recorded. Despite the long ago set record, temperatures are increasing for the division, along with SSTs off our coast. Finally, please feel free to provide feedback on the first installment of our Climate Division Series. Is there any special topic you’d like to see in subsequent series? Email/tweet/Facebook us (climate@atmos.washington.edu; @WAStateClimate).