By Nick Bond
WA gets its fair share of nasty weather, and these weather events can cause millions of dollars in damages. The types of events that have the biggest impacts, however, vary markedly from year to year (and do not always make headlines). This note explores the costliest weather events since the turn of the century. We define the “big events” as a single event that caused more than $1 million in damage.
Figures 1 and 2 show statistics for each water year (October 1-September 30) from the National Climatic Data Center’s Storm Database. Each water year (WY) uses four indicators to judge the severity of the weather: weather-related property damage, crop damage, deaths, and injuries. The figures illustrate the high variability of these costly events. Water years 2000 and 2010, for example, have a low amount of property damage reported and less than $1 million in crop damage (Figure 1). WY 2008, on the other hand, had $128 million in property damage and $105 million in crop damage – the highest of the years sampled.
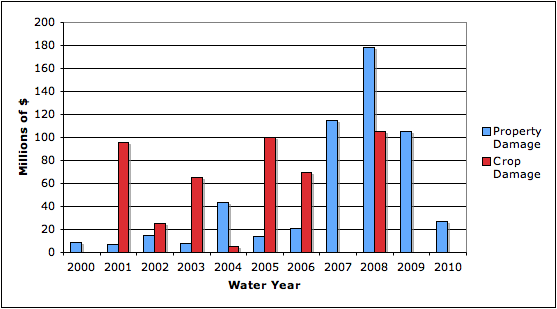 Figure 1: Monetary value of property (blue) and crop (red) damage done by weather events for the last decade (from NCDC’s Storm Database).
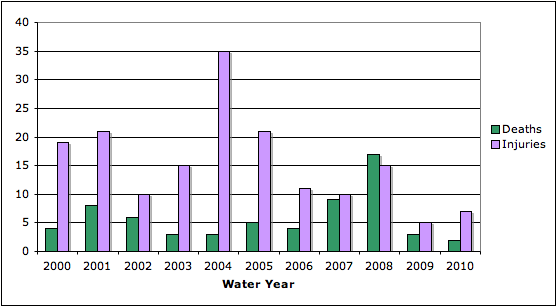 Figure 2: Number of deaths (green) and injuries (purple) resulting from weather events during the last decade (from NCDC’s Storm Database).
Some of the more interesting findings came from looking at the big events for each WY. Water years 2003 and 2006 had roughly the same amount of total damage to crops, but the damage resulted from completely different types of weather hazards. Extremely cold temperatures in early November harmed the apple crop in the Yakima region in 2003, and most ($37.7 million) of the crop damage in 2006 was due to 1.25-in diameter hail throughout several eastern WA counties in early July. The damage reported in WY 2008 was mainly from one event; the high wind, heavy rain, record flooding in western WA on December 2-3, 2007 that totaled $161.2 million in property damage. A similar situation occurred in WY 2007, in which 61% of the total property damage can be attributed to heavy rain on November 2-7 2006 in western WA, with much of the damage occurring Mt. Rainier National Park. On the other hand, some years did not have a defining event that accounted for most of the property or crop damage. WY 2004, for example, had more than $40 million in property damage (Figure 1) that came from many different instances of flooding and high winds, with a heavy snow event thrown in for good measure.
Interestingly, the pattern of deaths and injuries, shown in Figure 2, does not match the Figure 1 pattern. There is a clear disparity between the low property and crop damages and the high number of injuries for WY 2004. 20 of the 35 injuries were due to a dust storm near Prosser on Oct 28 causing a traffic pileup. No monetary value to the damages was assigned. WY 2001 also had a high number of injuries that weren’t associated with the water year’s big events – they resulted from a variety of less costly events including wildfires, high winds causing trees to fall, low visibility due to fog, etc. WY 2008 is the exception, in which most of the deaths and injuries resulted from the costliest event during the water year. WY 2008 also has both the highest number of deaths and the most property damage.
Finally, we want to again emphasize both the wide range of types of costly events and the range of personal and property damage experienced in WA from year-to-year. From this perspective, the 2010 WY was docile, with only $27.1 million in property damage (nearly all caused by landslides near Naches on Oct 11, 2009), 2 deaths (the least in the entire period examined), and 7 injuries. It also worth noting, as a final example of the different kinds of high impact events, that 86% of the relatively small property damage in WY 2005 was from a drought declaration made by the governor, an often-overlooked high cost weather phenomenon.
It bears emphasizing that the impacts discussed here involve only the direct effects of the weather. Less directly, the weather influences a range of other variables such as hydropower generation/utility costs, salmon productivity, human health, etc. It is safe to say that the weather is a big deal, and that unusual and disruptive episodes are the rule rather than the exception. There is an increasing effort to understand how the climate modulates the frequency and severity of weather events, and here’s hoping that we will become better at anticipating them as a result of this ongoing work.