Back-to-Back La Niña and the Weather of the PNW
There are increasing indications that La Niña conditions will be present in the tropical Pacific during the upcoming winter. As most of the readers of this newsletter are aware, this is right on the heels of a La Niña event during the previous winter and spring of 2010-11. Here we will examine the weather we have experienced in Washington State during the latter half of previous back-to-back La Niña events. Please feel free to either cheer or boo these findings.
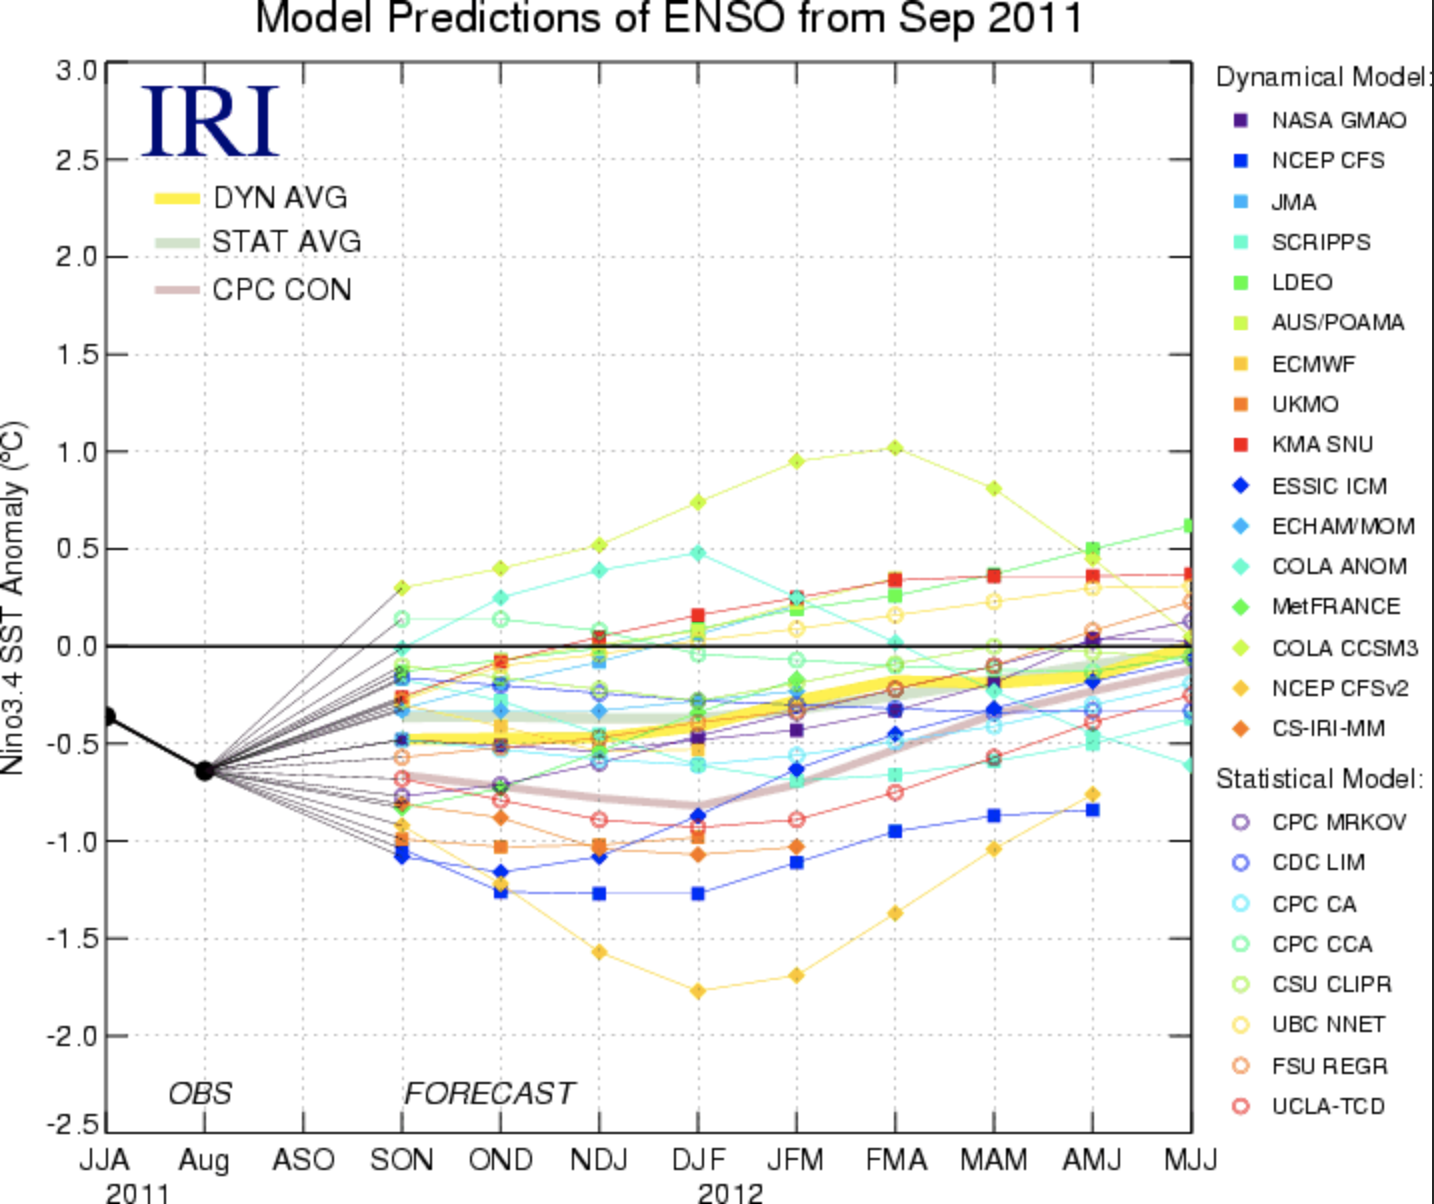
It is worthwhile to first consider the predictions for La Niña itself. As recently as a couple of months ago, our crystal ball was showing that near-neutral conditions for the upcoming winter were most likely, based on real-time observations and forecast models of various types for the tropical Pacific. Expectations have changed, however. In particular, NOAA’s Climate Prediction Center is now projecting a La Niña of weak to moderate intensity. To an extent, this reflects the simulations from its own Coupled Forecast System (CFS) model, which is showing stronger cooling than most of the other models. But it is also based on what the different models are indicating as a group, which is much more of a tendency towards La Niña in recent versus earlier runs. That being said, there is still a large amount of spread in the individual model forecasts, as illustrated in Figure 1. At the time of this writing, it is probably safe to say that there will not be El Nino. But we are not as confident as we were last year that there will be La Niña of a magnitude that could be expected to have impacts on the seasonal weather of the Pacific Northwest.
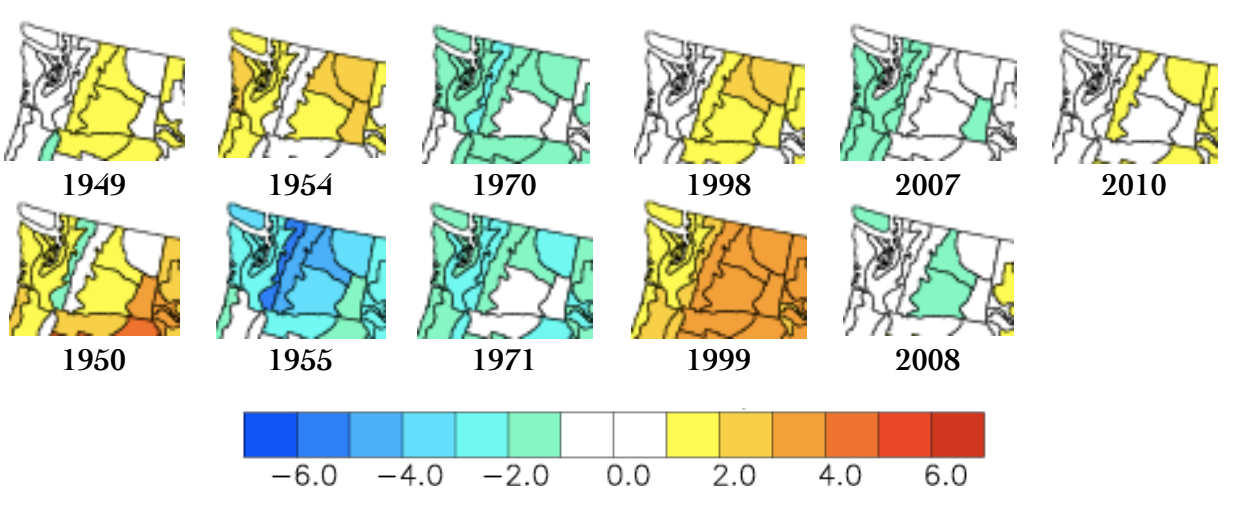
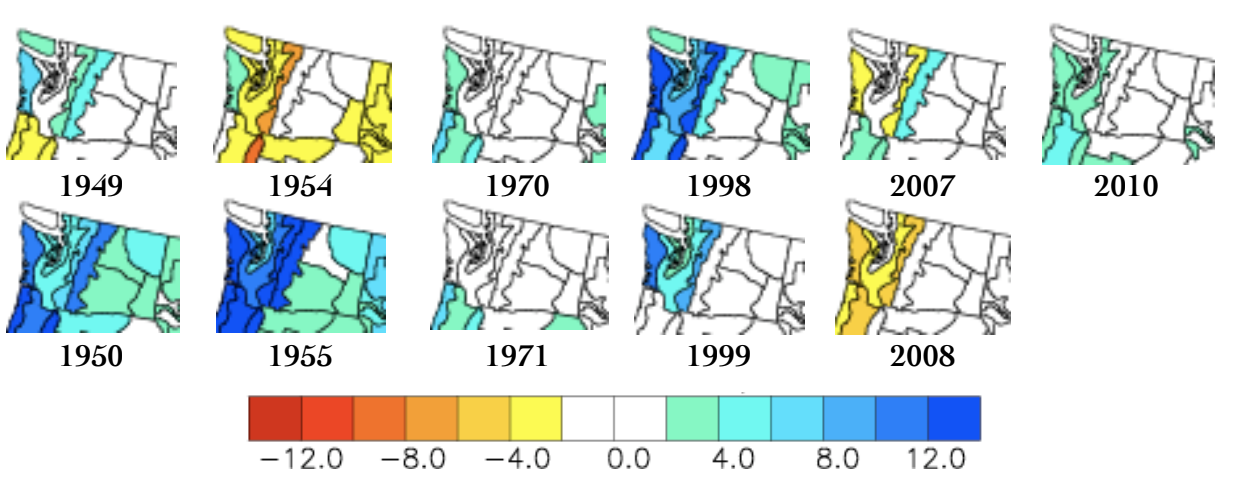
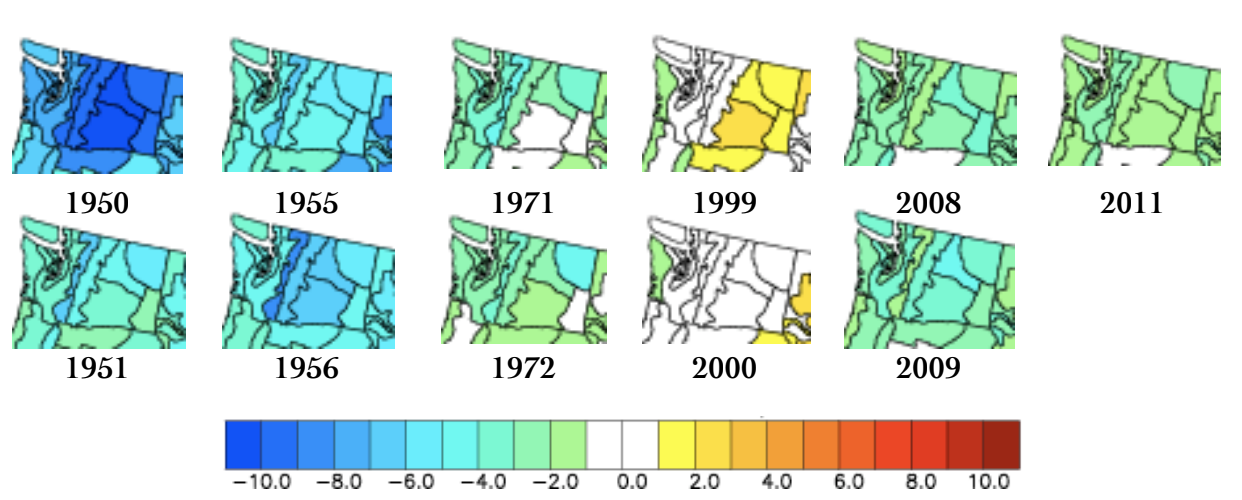
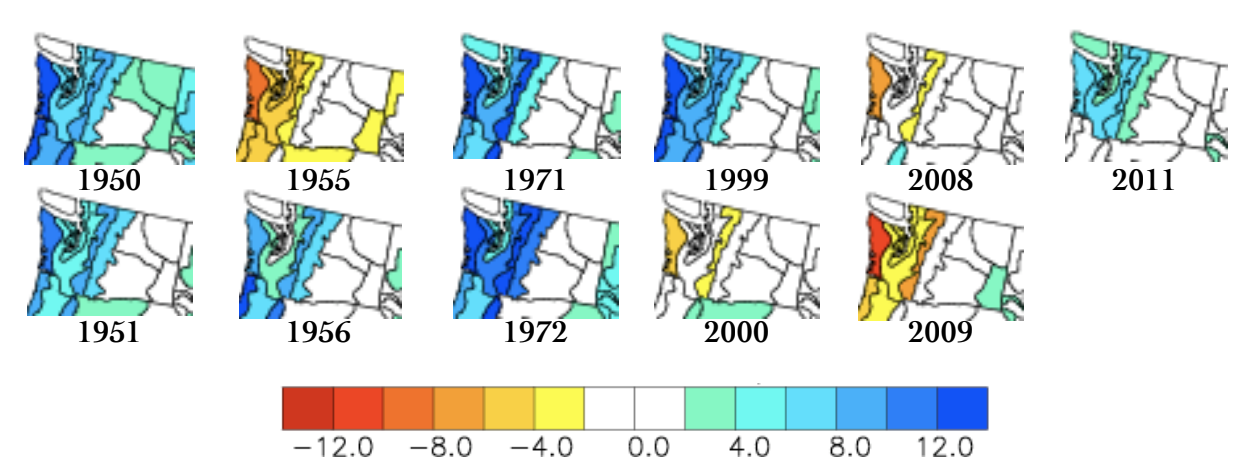
Under the premise that La Niña will be in place, we now examine how the weather of Washington has turned out during past events, with the objective of showing ranges as well as typical outcomes. One way to do this is through maps of the temperature and precipitation anomalies that have occurred in the early portion (Oct-Dec) and late portion (Jan-Mar) of past cool seasons featuring La Niña doubleheaders. The distributions of anomalous temperature and precipitation for October through December are shown in Figures 2a and 2b, respectively; their counterparts for January through March are shown in Figures 3a and 3b. From the perspective of Washington State as a whole, the second year has a comparable mean signal, and degree of variability in this signal, as the first year of these multiple year events. As for La Niña in general, there is a tendency for wetter than normal weather before (but not much of a systematic effect in temperature) before the first of the year, and a tendency for colder and somewhat wetter than usual weather after the first of the year. The magnitude of La Niña, as gauged by the NINO3.4 index, on average has been about half as strong during the second winter than during the first winter of the past events, and the present case appears that it will play out similarly. It is interesting that this difference in the intensity of La Niña does not seem to matter much in terms of its impacts on our weather, but this is an uncertain result because of the small sample size. It is also worth mentioning that La Niña, and other phenomena influencing our climate, are manifested on seasonal and longer time scales. In other words, we cannot anticipate anything about the timing of floods, wind storms or cold-air outbreaks. For example, the weather during January 2011 was on the quiet side and many folks were wondering what happened to the rough conditions that were predicted. It was later in February and into spring that we had the chance to experience La Niña’s usual charms. On the other hand, La Niña does not usually influence our weather significantly in late spring and early summer, and so we should not necessarily expect a repeat of the damp and chill that occurred during May through mid-July of 2011.
In summary, the dice are loaded for the next six months or so to be on the wet and cool side. That may not sound like good news, but that kind of weather brings some real benefits to the region, even if you are not a winter sports enthusiast. In particular, one of the more robust signals associated with La Niña is the snowpack at the end of winter. We rely on that “water in the bank” for municipal and agricultural uses and hydropower generation, and for healthy streams and forests. Perhaps that idea will provide scant comfort as we slog our way through winter, especially if this one turns out on the nasty side. There is a silver lining: at least in the observational record there has never been three La Nina winters in a row!