By Nick Bond
The month of January 1950 is legendary in terms of the weather in the northwestern US. It is the coldest month on record for Washington State, with the mean of 14.5 degrees F amounting to almost 16 °F colder than the average January for the period of 1910 through 2009. A host of all-time minimum temperature records were set, especially on the west side of the Cascade Mountains. The 61st anniversary of this month (OK so it is not a round number) is upon us and the readers of this newsletter might be interested in revisiting this spectacular event. This brief analysis is also motivated by a recent review of the weather of January 1950 carried out by Professor Mike Wallace of the Department of Atmospheric Sciences at the University of Washington. Mark Albright of the Department of Atmospheric Sciences had the good sense to keep some newspaper clippings from this month saved by his parents; we draw upon those here. We will first consider the month as a whole including the atmospheric flow aloft, provide some details on the individual storms and cold-air outbreaks that occurred, and conclude with some comparisons with other extreme months in the record.
A map of the temperature anomalies during January 1950 for the lower 48 states of the US is shown in Figure 1. The western US was in the deep freeze, with peak mean temperature anomalies of more than 25 °F below normal in north-central Montana. As is often the case, these extremes were accompanied by anomalies of the opposite sign in the eastern US. Portions of the Deep South experienced positive anomalies as large as about 15 °F. These temperature anomalies were associated with the distribution of anomalous 500 hPa geopotential height shown in Figure 2. A deep trough extended from the Pacific states into central Canada, with peak 500 hPa height anomalies exceeding 250 m in southeastern British Columbia. Of even higher amplitude was the anomalous ridge to the west, with peak values exceeding 350 m over the southeastern Bering Sea. These are enormous signals. For the two regions, those anomalies are of amplitudes greater than 3 standard deviations, and the largest on record for January over the period of the NCEP/NCAR Reanalysis (1948-present). The 500 hPa height pattern implies anomalous flow out of western Canada into the western part of Washington. This might be assumed to lead to abnormally light precipitation but in actuality, precipitation amounts were near normal (not shown) due to considerable storminess, as discussed below. As a bit of an aside, the portion of the US that experienced the most unusual precipitation during the month was the central Midwest. Precipitation surpluses as great as 10” above normal occurred in the lower Ohio River valley in association with the anomalous southwesterly flow on the east side of the aforementioned 500 hPa trough.
Monthly means tell part of the story, but the impacts of weather on society are usually associated with individual events, and January 1950 was certainly no exception. For purposes of illustration, time series of daily mean temperatures for Spokane Airport (GEG) and SeaTac Airport (SEA) are shown in Figure 3. The month started out on the chilly side, with some significant snowfall, especially in the western half of the state, but that was just an appetizer. After more moderate temperatures during the second week of month, but still considerable snowfall in the eastern portion of the state, a noteworthy storm slammed the Pacific Northwest. This storm brought heavy snowfall, fierce winds and bitterly cold temperatures. Seattle received 20” of snow on the 13th, its second greatest daily amount on record. The temperatures plummeted to below zero °F that day in Spokane, and the Airport received 8” of snow. The liquid equivalent of Spokane’s snowfall that day was 0.44”, which is an amazingly high amount out of such a cold air mass. This situation was caused by the combination of high sea level pressure over British Columbia, a necessary condition for arctic-air outbreaks in WA, and a low off the mouth of the Columbia River with a trough extending eastward into western Montana. This set-up caused Whatcom County to hit the full trifecta of winter weather. According to the Bellingham Herald, winds of up to 75 MPH caused snow drifts as high as 10-14 feet followed by temperatures below 0 °F. This newspaper also reported some good news on the 13th for which the weather must have been a proximal cause: “City police received not one complaint of unlawful activity during the morning hours.” (Copies of the scanned January 1950 articles from the Bellingham Herald can be found at this link:
http://www.atmos.washington.edu/marka/bham_herald_jan50.cgi). The storm that occurred mid-month would have been enough for January 1950 to be long remembered, but there was plenty more severe weather. Specifically, after a relatively mild spell from the 20th through the 24th, yet another cold blast hit the state. While not quite as prolific a snow-maker, Seattle and Spokane checked in with 10” and 6”, respectively, for daily totals on the 26th. This event was characterized by particularly low temperatures in its wake, with SEA down to its all-time minimum temperature of 0 °F and GEG reaching its 2nd coldest minimum of -24 °F. All this is the stuff of fantasy for many meteorologists, and nightmares for emergency managers.
The abnormally cold weather of January 1950 begs the question, just how unusual was it? After all, extremely unlikely events are not just possible but rather should be expected to occur every once in a while. Towards addressing this question, a time series of the mean temperatures in Washington State during the Januarys of 1910 through 2009 are shown in Figure 4. This time series has some interesting properties. The record cold of January 1950 is almost matched by that in 1930, 1937 and 1949. The distribution is highly skewed, with fewer but more intense cold months and more frequent but less extreme warm anomalies. It appears that the warmest it can get for the month as a whole is about 7 °F above normal. Our warmest air in winter is during southwesterly flow off the Pacific Ocean, and months with a preponderance of these conditions will be warmer on the whole. This may produce an effective ceiling on our temperatures because the underlying sea surface temperature (SST) in this source region does not vary that much from year-to year, while continental regions tend to experience much greater fluctuations in temperature. It is also interesting that while any sort of systematic trend in the temperature is minimal, especially over the last few decades, there also has not been an extremely cold January since 1979. Finally, it bears noting that 1949-50 was a La Nina winter. The weak-moderate La Nina in progress may improve the odds of having a relatively cold January in 2012, but there is no indication that anything like its counterpart in 1950 is on the horizon. If it did somehow happen to occur one of these winters, readers of this newsletter might be able to guess whether the OWSC would relish the opportunity to review another month akin to January 1950.
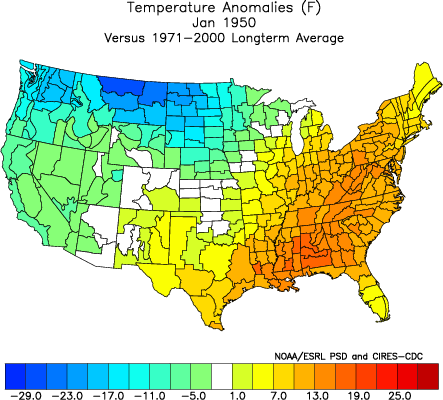 Figure 1: January 1950 temperature anomalies (°F) for the United States compared to the 1971-2000 normal (from ESRL).
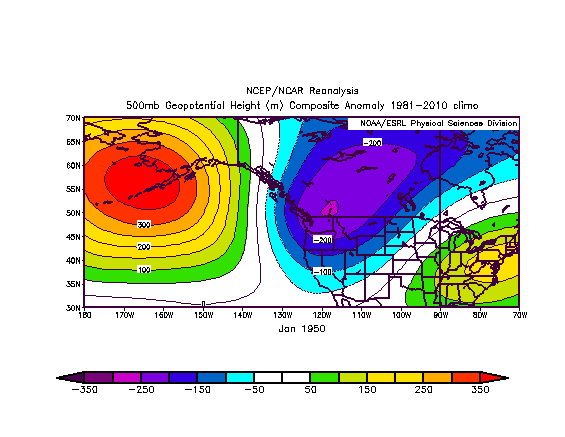 Figure 2: Average 500 hPa geopotential height field during January 1950 compared to the 1981-2010 normal pattern (from ESRL).
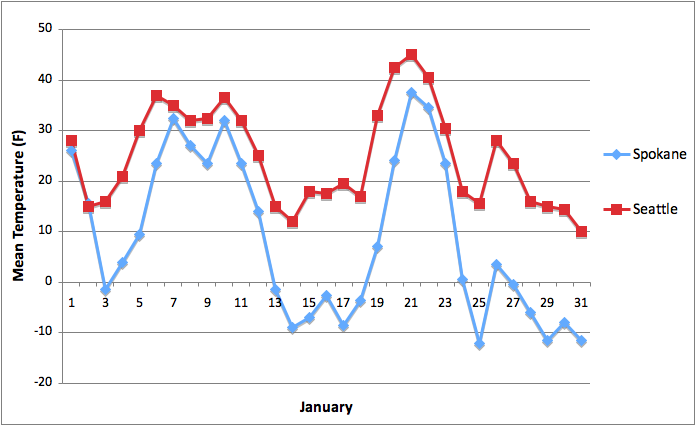 Figure 3: Daily mean temperature (°F) during January 1950 for Seattle (red) and Spokane (blue).
 Figure 4: Mean January temperature averaged over WA from 1910 to 2009 (red) and long-term average (black; 1910-2009) from NCDC.