By Nick Bond
There is the common impression that the weather on the 4th of July is generally crummy, at least on the west side of Washington State. Here we take the opportunity to critically examine that perception, and to compare the climatology of that day on the west versus east side of the Cascade Mountains. In addition, the conventional wisdom is that there is dramatic improvement in the weather shortly after the 4th, and hence it is also of interest to document just how much it typically changes over the course of the month of July.
Daily station data from 1981-2010 are considered for six western and six eastern Washington locations. The specific variables of interest are the probability of measurable precipitation (POP) and frequency of maximum temperatures reaching prescribed thresholds for the calendar days of the month. The maximum daily temperature thresholds used were arbitrarily set at greater than or equal to 70 F for the western stations and greater than or equal to 80 F for the eastern stations. In other words, a different standard was used for what constitutes a warm day in the west versus east part of the state. We present the 30-year averages for the POP and frequency of warm days on the 4th of July for the western stations at Forks, Hoquiam, Bellingham, SeaTac, Olympia, and Vancouver, and for the eastern locations of Winthrop, Wenatchee, Yakima, Spokane, Pullman, and Walla Walla. Time series of daily average POP and frequency of warm days for the month of July are plotted for Hoquiam and SeaTac, and for Yakima and Spokane. The NCEP Reanalysis data were used to examine various parameters that characterize the regional circulation; shown here are climatological mean distributions of the zonal (east-west) component of the wind at the 500 hPa level for the first week and for the last week of July.
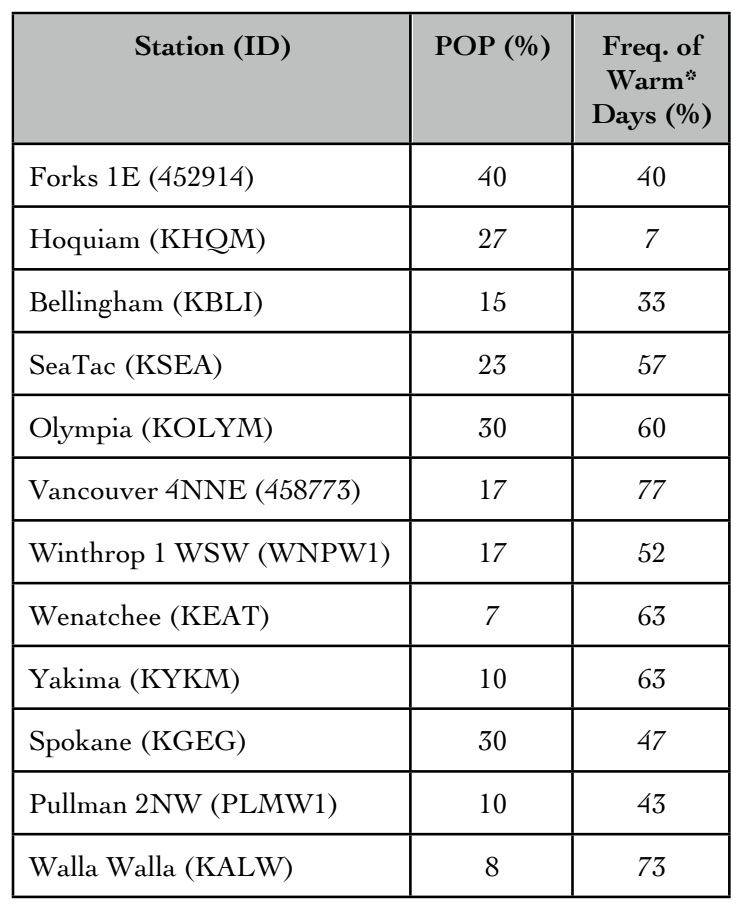 Table 1: Frequency of measurable precipitation and warm days on the 4th of July at selected locations in WA State based on the 1981-2010 period. *Warm days are defined at those with maximum temperatures greater than or equal to 70°F (80°F) for locations west (east) of the Cascade Mountains.
The results for the 4th of July are summarized in Table 1. With regards to POP, as expected the coastal locations of Forks and Hoquiam checked in as the places that are more likely to experience a wet Independence Day. It was a surprise, however, to find that it has rained at least as often at Spokane (30% of the time) as at the interior western Washington locations. In particular, measureable rain occurred in Seattle (KSEA) only 8 times on this day of the year in the 30-year interval. The idea that “it usually rains on the 4th of July” in the Seattle area is a myth. There are also some quirks in terms of the frequencies of warm days. They have occurred on the 4th much more often at Forks than at Hoquiam; among the interior locations in the west it is more than twice as likely to get one at Vancouver than at Bellingham. Among the east side locations, maximum temperatures into the “warm” category (many of us wimps on the west side probably would call that “hot”) are most likely in Walla Walla and the Tri-Cities (not shown) and least likely in Spokane and Pullman. The driest station of this set was Wenatchee, but Yakima, Pullman and Walla Walla also have a 10% or less chance of rain based on this 30-year record.
Many locations in Washington State become noticeably drier and warmer after the first part of July. Time series of POP and frequency of warm days for Hoquiam and SeaTac (Figure 1a) reveal marked decreases in POP during the first week of the month and then slow declines over the remainder of the month to values of about 15% and 10%, respectively. This drying out is accompanied by only a modest increase in the frequency of warm days at Hoquiam. On the other hand, 70+ F days in Seattle by the end of the month are a very good bet. The corresponding time series for Yakima and Spokane are shown in Figure 1b. Yakima tends to get slightly more rainy days early than late in the month. A more significant drop in POP was found for Spokane. While the 4th at Spokane has been relatively rainy it is no real fluke; both 2 July and 10 July have even higher values of POP (33%) over the 1981-2010 period. Along with the drying over the course of the month, the chances of a 80+ F day in Spokane almost double from the beginning to end of July.
 Figure 2a: The July time series of the POP and frequency of warm days for Hoquiam and Seattle.
 Figure 1b: The July time series of the POP and frequency of warm days for Yakima and Spokane.
Why is early July so much wetter and cooler than late July across much of the state? This transition in the weather is linked to evolution in the regional atmospheric circulation, mostly in the form of a poleward shift. For example, the mean 500 hPa zonal wind has a maximum across northern Oregon during the first week of July (Figure 2a); this flow is weaker and has its maximum along the US-Canada border during the last week of the month (Figure 2b). Over the same interval the axis of higher sea level pressure representing the eastward extension of the North Pacific High moves from across Washington state to across British Columbia in the mean (not shown). These changes are accompanied by a tendency for more sinking motion at mid-tropospheric levels, especially over the northern half of the state. As a bit of an aside, it bears pointing out that the onset of more consistently dry and warm weather here basically coincides with the onset of the monsoon in the desert southwest US. It would be a good thing if we could anticipate year–to-year variations in the timing of these shifts, such as the late occurrence in 2011, but their predictability on time horizons of more than a week or two is an open question.
 Figure 2a: The 500 hPa zonal (east-west) wind for the first week of July.
 Figure 2b: The 500 hPa zonal (east-west) wind for the last week of July.