By Nick Bond
Ozone (O3) is an important pollutant in many regions, especially during summer months, and Washington State is no exception. While O3 is beneficial in the upper-atmosphere through its absorption of damaging ultraviolet (UV) radiation, it is harmful near the surface. It tends to cause reduced lung function, which is of special concern to those with compromised respiratory systems, but can also affect an otherwise healthy individual. Ozone at ground level can also damage agricultural crops and forests. Certain locations in Washington, particularly the west foothills of the Cascade Mountains, are more prone to experience O3 concentrations above a standard of 75 ppb established by the Environmental Protection Agency (EPA) as a threshold for human health considerations. The air chemistry involving O3 is rather complicated. In a nutshell, direct emissions of O3 are minimal and instead most O3 forms when key precursor chemical constituents, namely nitrogen oxides (NOx) and volatile organic compounds (VOC), react in the presence of sunlight. This process is enhanced during warm weather. The objective of the present note is to examine the relationship between day-to-day variations in the weather and peak concentrations of O3 in the Puget Sound region and Spokane.
Our analysis is based on the following data: (1) daily maximum 8 hr O3 concentrations from Enumclaw (Mud Mountain Dam) and Spokane for 2000-2011 from the Puget Sound Clean Air Agency, and (2) daily maximum air temperatures from SeaTac (SEA) and Spokane International Airport (GEG). We use the O3 record at Enumclaw because it is a location that is out of compliance with the EPA standard relatively frequently. Comparisons between the daily maximum air temperatures and O3 concentrations for the two pairs of sites were made for the months of July and August during both cool and warm summers; for brevity’s sake results are shown here just for the warm summer of 2009. We also examined the values of peak O3 concentration during heat waves in the Seattle area, arbitrarily defined as those periods during which temperatures at SEA reached 90 F or higher.
Time series of daily maximum air temperature and O3 concentration for July though August of 2009 are plotted here for SEA and Enumclaw (Figure 1a) and GEG and Spokane (Figure 1b). There is a striking correspondence between hotter (cooler) days and higher (lower) O3 concentrations in western WA; the correlation coefficient between the two time series is 0.84 (other years had comparable values). There is also a positive relationship between temperature and O3 in Spokane, but with a lower value for the correlation coefficient (0.62 in 2009). Note that while temperatures are generally hotter in Spokane than in Seattle, peak O3 concentrations (smog events) are greater in western WA. This difference can be attributed primarily to the higher population in the Puget Sound region, and hence greater emissions of NOx and VOC.
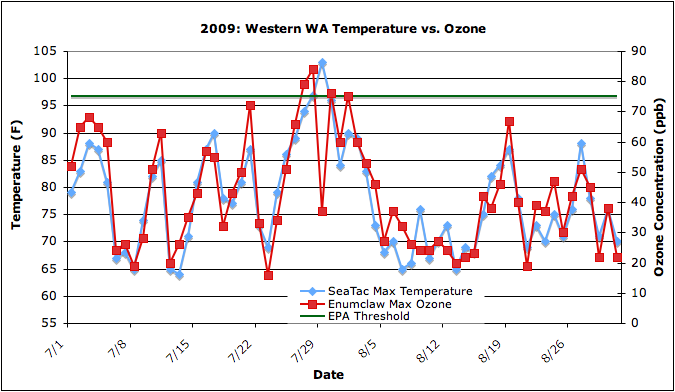 Figure 1a: July and August 2009 maximum temperature (blue) and ozone concentration (red) for Seattle (max T) and Enumclaw (O3). The green line represents the EPA threshold for O3 to impact human health.
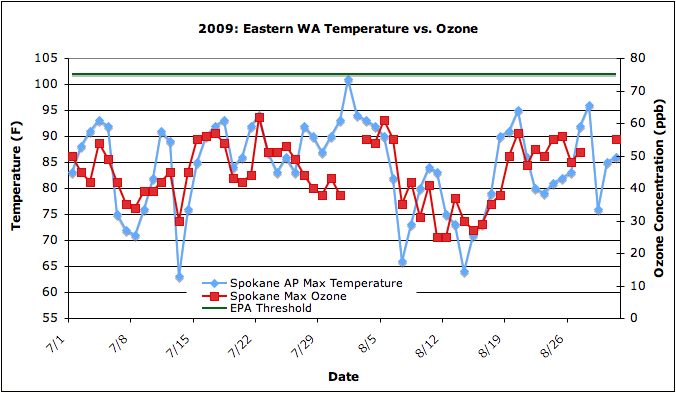 Figure 1b: July and August 2009 maximum temperature (blue) and ozone concentration (red) for Spokane. The green line represents the EPA threshold for O3 to impact human health.
It is clear that unseasonably warm and sunny days are typically accompanied by elevated ozone levels. But are the very hottest days necessarily the most polluted? The scatterplot of maximum air temperature at SEA versus maximum O3 concentration at Enumclaw for all of the heat waves at SEA since 2000 (Figure 2) suggests otherwise. There have been 5 of these heat waves for which the peak temperature was 90 F, and the maximum O3 concentrations have ranged from 55 to 99 ppb, i.e., from the lowest to the second-highest in the set. The all-time record heat of July 2009, including a 103 F at SEA, was accompanied by elevated O3, but six other heat waves in the last decade had higher levels. The time series for 2009 shown in Figure 1a hints at a possible explanation. Specifically, note that a somewhat lower value of maximum O3 was recorded at Enumclaw on the hottest day at SEA (29 July). During that particular day, southeasterly winds were observed at North Bend, WA in the Cascade foothills, while 28 and 30 July had winds from the northwest (not shown). It appears that air originating from the urban portion of the Puget Sound did not make it all the way into the foothills on 29 July. As an aside, stations near the Sound such as SEA and Boeing Field had northwesterly winds on all three afternoons. It makes sense that the details in air trajectories would be important to the peak O3 concentrations in any particular spot, but a complete analysis is well beyond our present scope. The bottom line is that the hottest days do not necessarily have the very highest O3 concentrations.
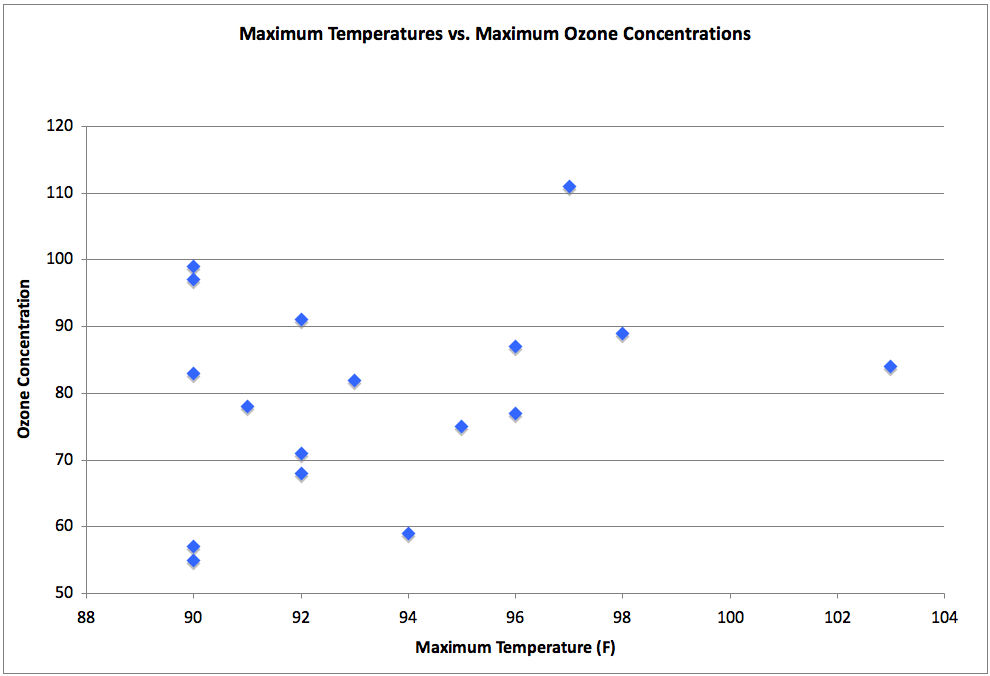 Figure 2: Scatterplot of maximum temperature at SEA (°F) versus maximum 8-hr O3 concentrations (ppb) at Mud Mountain Dam in Enumclaw. Each maximum represents the peak value over a period from the day before to the day afterwards during which the maximum temperature at SEA reached 90°F or higher. The data is from 2001-2011.
Additional information on ozone in the Pacific Northwest is available from the Puget Sound Clean Air Agency, among other organizations. In general, O3 is limited more by VOC rather than NOx in this region. A major source of both constituents is vehicular emissions. Conifer trees can also be a significant source of VOC, and in turn, can be adversely impacted by high O3 levels. Forecasts for O3 out to about 2 days are available on WSU’s Airpact website (https://airpact.wsu.edu ). When hot weather is expected, everyone can do their part in minimizing smog by trying to limit use of motorized vehicles and to reduce other sources of VOC and NOx. Besides isn’t it better to be sipping a cool drink in the shade rather than stuck in traffic during that kind of weather?