By Nick Bond
It may seem that the climate community is often making a fuss about the phenomenon of El Niño-Southern Oscillation (ENSO), and this impression is correct. Why is there such an emphasis? ENSO represents the primary source of predictability in seasonal weather in many parts of the world, including the Pacific Northwest. But not all ENSO events, i.e., El Niño (or their La Niña counterparts) play out similarly over the North Pacific Ocean and North America. The intrinsic variability of the atmospheric circulation at mid-latitudes is probably the primary reason, but there is increasing appreciation that differences between the tropical Pacific characteristics of individual events may be important, too.
The longitude of peak anomalies in SST, and especially in rainfall, appears to be a key determinant of the mid-latitude response to El Niño (Chiodi and Harrison, Journal of Climate, 2012). This may seem obvious, but is at least somewhat at odds with the results from idealized models developed by Branstator and others in the 1980s and 1990s to diagnose how ENSO impacts the atmospheric circulation in the mid-latitudes. These models indicated that the sensitivity was greatest to the NINO 3.4 region of the tropical Pacific, and a SST index based on that became widely used. More recently, D.E. Harrison et al. and others examined response to events with anomalies largest in eastern versus central Pacific and found considerable differences. Following up on this idea, we illustrate here the composite temperature (Figure 1) and precipitation (Figure 2) anomalies for the US in October through March during the last 5 central Pacific El Niño events (1987-88, 1994-95, 2002-03, 2006-07 and 2009-10). Note that the average temperature anomalies for the October-March period during these conditions has been about one-half of a standard deviation (equivalent to about 0.5 to 1°F). In terms of precipitation, most of the Pacific Northwest has been on the dry side, but generally only slightly so, and some climate divisions in the eastern part of WA have even recorded above normal precipitation. By way of comparison, during the east Pacific El Niño events of the last few decades (1982-83, 1986-87, 1991-92, and 1997-98) the temperature signal has been about twice as large (not shown). The 1982-83 and 1997-98 El Niño events were also very strong, which is an important additional consideration.
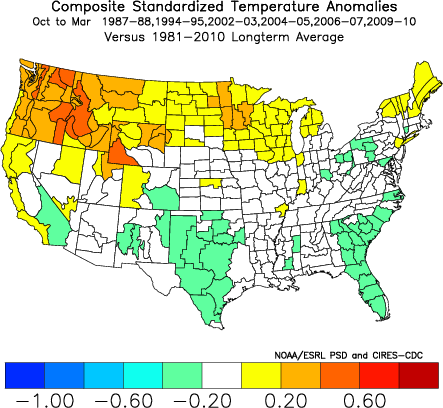 Figure 1: Composite temperature anomalies for the last 5 central Pacific El Niño events.
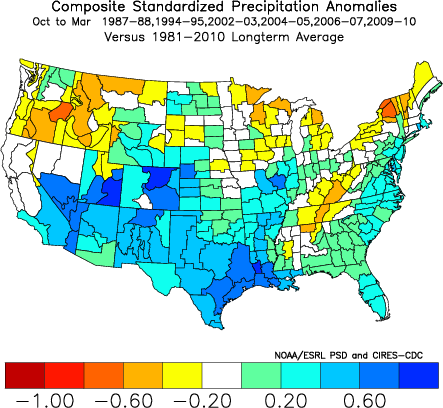 Figure 2: Same as Figure 1, except for precipitation anomalies.
This piece has been motivated by the weak-moderate El Niño that appears to be in offing for the winter of 2012-13. At the time of this writing, the SST is warmer than normal in the central and eastern tropical Pacific, with the greatest anomalies between 150W and 140W. Recent simulations from one of the state-of-the-art models used in operational ENSO forecasting, NOAA’s Coupled Forecast System (CFS) model indicate that the SST anomalies will strengthen in the central Pacific and farther west towards the dateline (Figure 3). It is unknown the degree to which other models used to forecast ENSO are indicating a similar outcome for the upcoming winter (many of these models do not make distinctions with respect to longitude). The CFS model predictions for the tropical Pacific, in particular the lack of strongly positive SST anomalies in the far eastern Pacific, suggest that this El Niño might not be that big of a deal for the Pacific Northwest. On the other hand, the temperature and precipitation predictions from the CFS for the Pacific Northwest indicate warm and dry relative to seasonal norms, especially after the first of the year (not shown). It is possible that the CFS is picking up on other potential sources of predictability such as current patterns in mid-latitude upper ocean temperature, soil moisture, and sea ice cover. Perhaps the winter of 2009-10 represents a reasonable analog, from an overall perspective, for the upcoming winter. The winter of 2009-10 also featured an El Niño of weak to moderate intensity on the heels of back-to-back La Niña events. It ended up being warmer and drier than normal, but not extremely so, in part due to substantial snowfall in the mountains from late March into April 2010, and hence the repercussions were mostly modest. It bears mentioning that the winter of 2009-10 included a pronounced cold snap in early December. So while the deck may be stacked, it is still possible to get virtually any kind of deal of the weather cards.
 Figure 3: The CFS ENSO forecast initialized in August (from CPC).