By Karin Bumbaco
A water year in the Pacific Northwest begins on October 1 and ends on September 30, and is labeled by the year it ends in. According to the American Meteorological Society’s Glossary of Meteorology, “It commences with the start of the season of soil moisture recharge, includes the season of maximum runoff […] and concludes with the completion of the season of maximum evapotranspiration”. In other words, it starts around here at the start of the beginning of our wet season. As we begin our journey into the 2013 water year, it is worth taking a look back at the temperature and precipitation for water year that just ended.
How does the 2012 water year (WY) compare to normal? Figure 1 shows the 2012 WY average temperature departure from normal and the total precipitation percent of normal (based on the 1981-2010 normal period) for WA State. Generally, western WA was colder and wetter than normal for WY 2012, except for the Olympic Peninsula where conditions were just barely on the dry side. Eastern WA experienced more variety in precipitation, with northeastern WA and southeastern WA wetter than normal while the Columbia Basin was drier than normal. Regarding temperature, the far northern and far southern portions were cooler than normal while the remaining eastern WA locations had above normal WY temperatures.
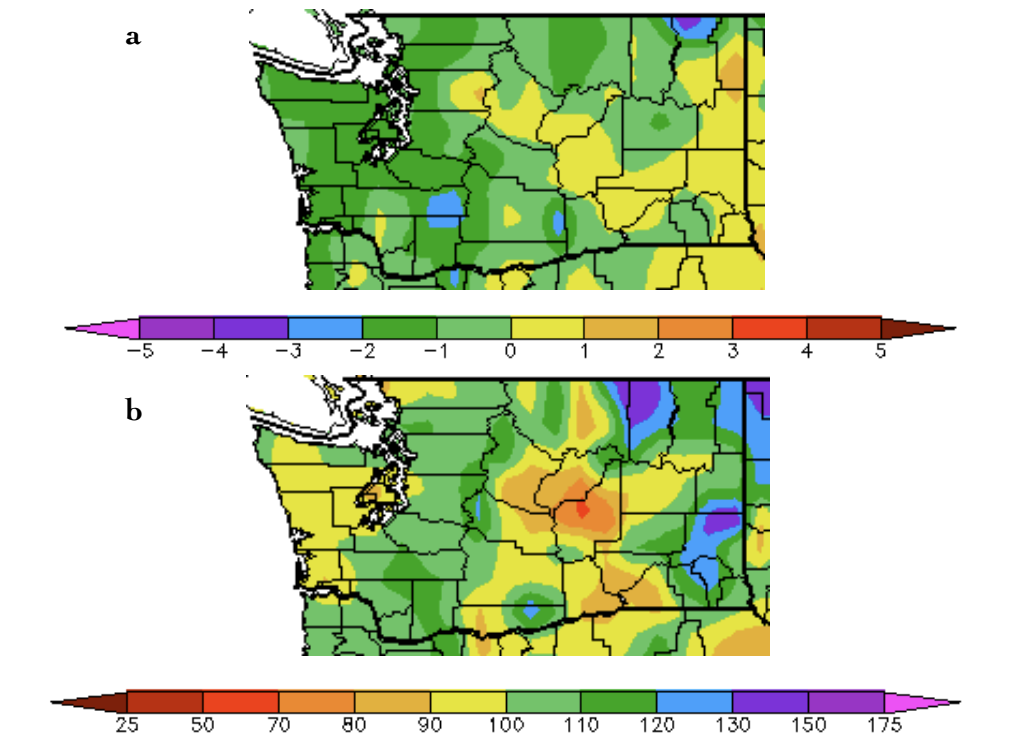 Figure 1: The (a) temperature departure from normal (°F) and (b) precipitation percent of normal for the 2012 water year [from HPRCC].A closer look at the monthly temperature and precipitation data for two WA locations yields further insights into the water year. Figures 2a and 2b show the monthly average temperature and total precipitation compared to normal for a western WA (Olympia Airport) and eastern WA (Spokane Airport) location. October and November 2011 started out on the dry side, and December was extremely dry for a majority of the state. Rains kicked in after January 1, and conditions were wetter than normal statewide through April with an extremely wet, record-setting period occurring in March. May was also wet west of the Cascade Mountains but dry in eastern WA. That represented just a brief respite, however, as wetter than normal conditions continued through June. July precipitation was variable due to considerable thunderstorm activity, and the end of the water year ended on an extremely dry note with little precipitation falling in August or September.
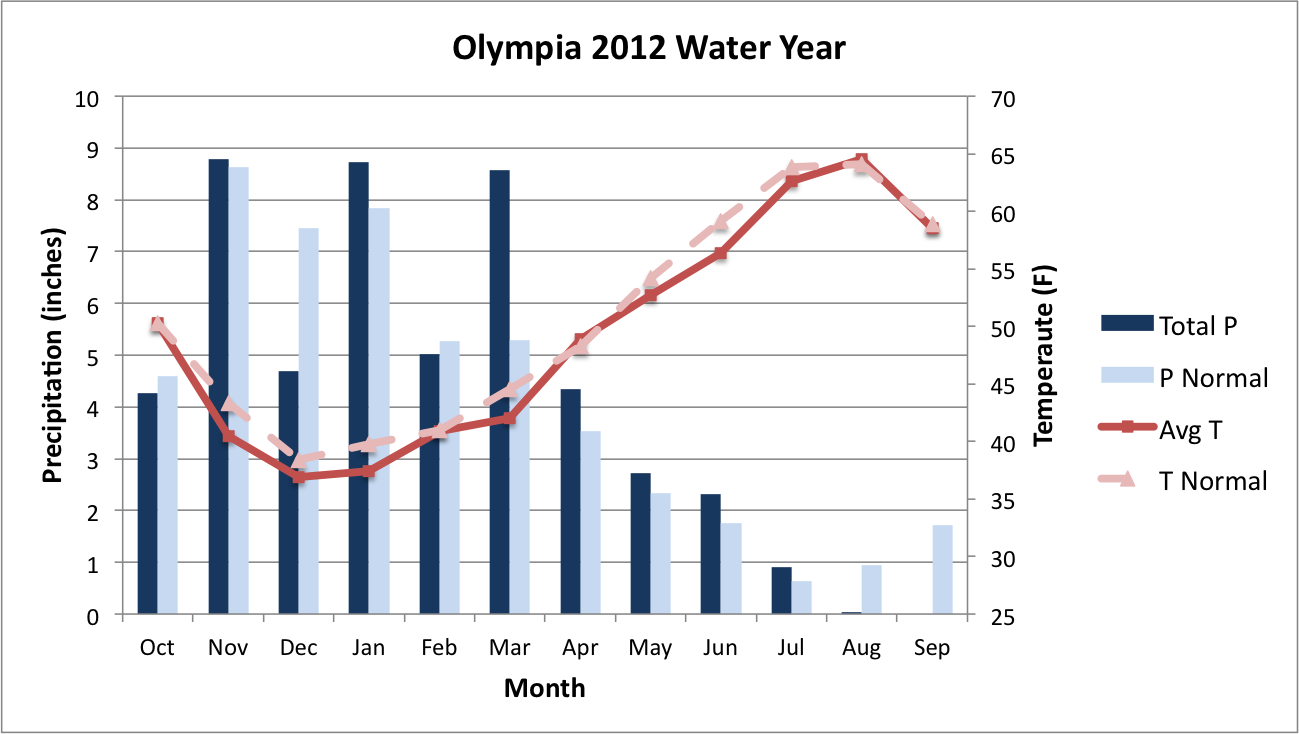 Figure 2a: 2012 water year summary for Olympia Airport.
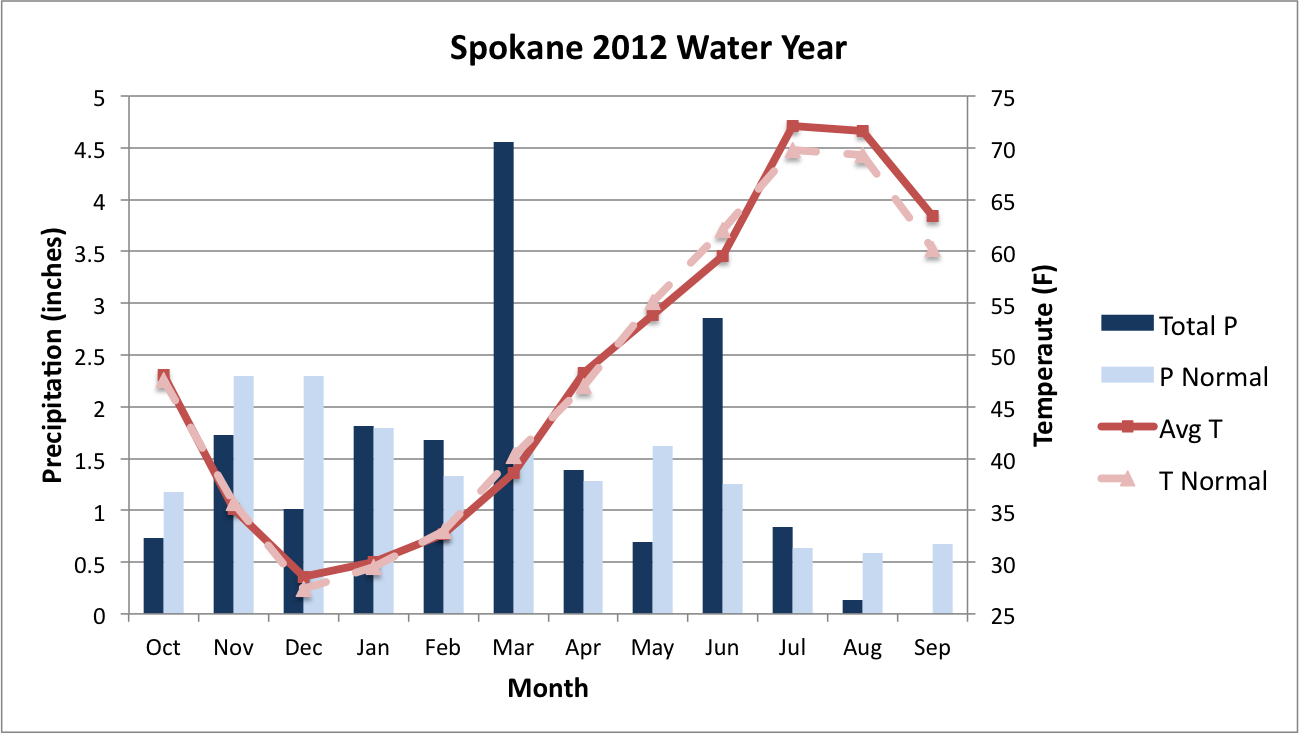 Figure 2b: 2012 water year summary for Spokane Airport.
Regarding temperatures, the WY started out with near-normal temperatures in October for nearly the entire state before colder than normal temperatures prevailed for most of winter and spring. February and April were exceptions, during which temperatures were above normal nearly statewide. Otherwise, November through June was on the cold side for a majority of the state. July remained colder than normal on the west side of the Cascade Mountains while it finally warmed above normal on the east side of the Cascades. The remaining two months in the water year – August and September – were warmer than normal statewide.
While there was variability statewide in WY temperature and precipitation, the WY was generally cooler and wetter than normal. The La Nina that existed in the equatorial tropical Pacific during a majority of the WY likely had an impact on that outcome. Unfortunately, the weak ENSO signal now present, and likely to continue through WY 2013, implies relatively low predictability for the year ahead. Nevertheless, NOAA’s Climate Prediction Center (CPC) is predicting below normal precipitation for the winter and early spring. These predictions are based in part on global climate model simulations that can, in principle, account for influences outside of the tropics such as current anomalies in sea surface temperature, ice cover, and soil moisture. It will be interesting to see how these models perform as a group over the next year or so, especially if ENSO takes a backseat.