By Nick Bond
The period from mid-November through early December is often the rainiest part of the year for Washington. It is no secret that the west side of the state is typically blessed with more rainy days than the east side, but to what extent? And what percentage of the time is it actually precipitating? How long can it rain without letting-up? While it clearly rains more often, does this time of year also include the storms with the greatest rain rates? These topics are addressed here in a follow-up to a paper on Seattle rainfall authored by Phil Church (the founder of the Department of Atmospheric Sciences at the University of Washington) that was published in Weatherwise in 1974.
The analysis is based on time series of hourly precipitation observed at Sea-Tac Airport (SEA) and Spokane International Airport (GEG) for the period of 1990-2010 as provided by NOAA/NCDC (https://www.ncdc.noaa.gov/cdo-web/). This data was used to calculate frequency of hours during which precipitation was recorded, the intensity and time of year of the most intense rain storms (specifically those hours with rainfall exceeding 0.30”), and the duration of the longest-lasting events of continuous precipitation, specifically, the number of consecutive hours with precipitation of either trace or measurable amounts.
The chances of measurable precipitation during a 24-hour period from mid-November through mid-December are about 60% at SEA and 45% at GEG. We suspect most west-siders do not realize that the days with precipitation occur so often in Spokane. Broadly speaking, this location can be considered to be in the low foothills of the west flank of the Rocky Mountains, and thereby experiences gentle upslope flow during periods of low-level winds from the west. The Columbia basin portion of eastern Washington is decidedly drier. Ephrata, for example, receives measurable precipitation on average during only about 33% of the days the same time of year.
The percentage of hours with precipitation recorded at SEA and GEG during Nov-Dec for the years of 1996-2010 illustrated in Figure 1. The average frequency is 31% at SEA and 22% at GEG; those hours with just trace amounts are about 13% of the time at each location. The resulting 18% of the hours that have measurable rain at SEA is virtually identical to the findings of Church (1974), which indicated average frequencies of 18% and 19% for November and December, respectively. We agree with Church’s rather testy statement, “While many visitors . . . and others . . . in Seattle complain that it rains all the time, simple arithmetic shows it rains a mere 11% of the time [when averaged over the whole year]”. This quote reminds us of the delightful book “Rains all the Time” by David Laskin, which is recommended for those interested in the human response to the weather of the Pacific Northwest. Getting back to the numbers, it is interesting that there were two years (2000 and 2008) during which it actually rained more often at GEG than at SEA. It is also striking how much year-to-year variability there is in the overall frequency of precipitation. Note that it rained more than twice as often at SEA in 1998 than during 1997 and 2000, and similarly for GEG there is greater than a factor of two between the year with the most frequent precipitation (2008), a snowy year, and years of the lowest frequencies (1997 and 2004).
The records at the two locations reveal some interesting differences with regards to the time of year when it rains the hardest (Figure 2). SEA receives its heaviest rains disproportionately during the fall while the downpours at GEG occur in spring and summer, presumably often in association with thunderstorms. Based on personal experience, the Puget Sound region can also receive some real cloudbursts during the spring, but apparently they rarely last long enough to produce more than 0.30” an hour in the rain gauge at SEA. On the other hand, there seems to be always enough rain around Puget Sound during spring to get folks grousing about the weather.
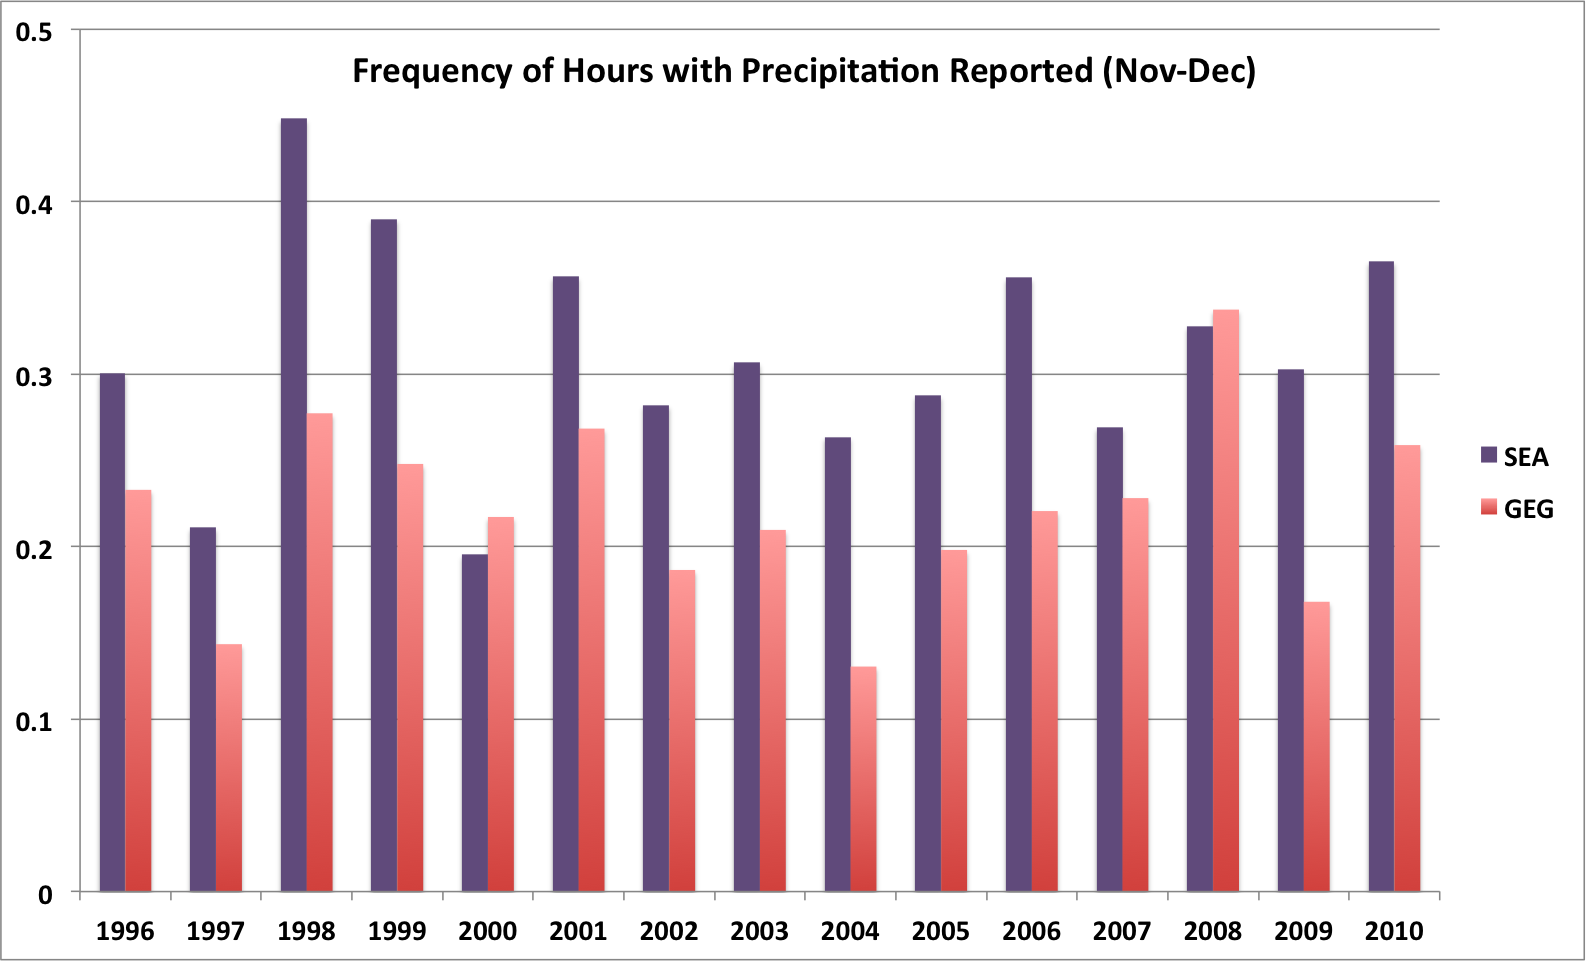 Figure 1: The frequency of hours reporting precipitation (including traces) from 1996 through 2010 during November and December at SeaTac Airport (SEA) and Spokane Airport (GEG).
The 20-year records include extremes in terms of duration of continuous precipitation of 59 hours at SEA during 11-13 November 1999, and 45 hours at GEG during 12-14 January 2006. We are impressed that such a prolonged rainfall event could happen at GEG. On the other hand, considering all the patches of moss masquerading as lawns in the Seattle area, we are not at all surprised that long rainfall events (rains of 53 and 54 hour duration occurred in December 1998 and January 2009, respectively) have been observed at SEA. Events of continuous precipitation, strictly speaking with consecutive hourly reports indicating precipitation of at least trace amounts, as long as 24 hours or longer occur on average almost 5 times a year at SEA and a bit more than twice a year at GEG.
We have certainly not exhausted all of the goodies in the hourly rainfall record. For example, how long is the typical rain storm? How much does the frequency of rain vary during the summer? Given that the record can be extended back in time, are there any systematic trends in the occurrence of the heaviest rainfall events? Does the frequency or intensity of rain vary more between wet and dry locations in the state? Hopefully we will be able to address these kinds of questions sometime in the future.
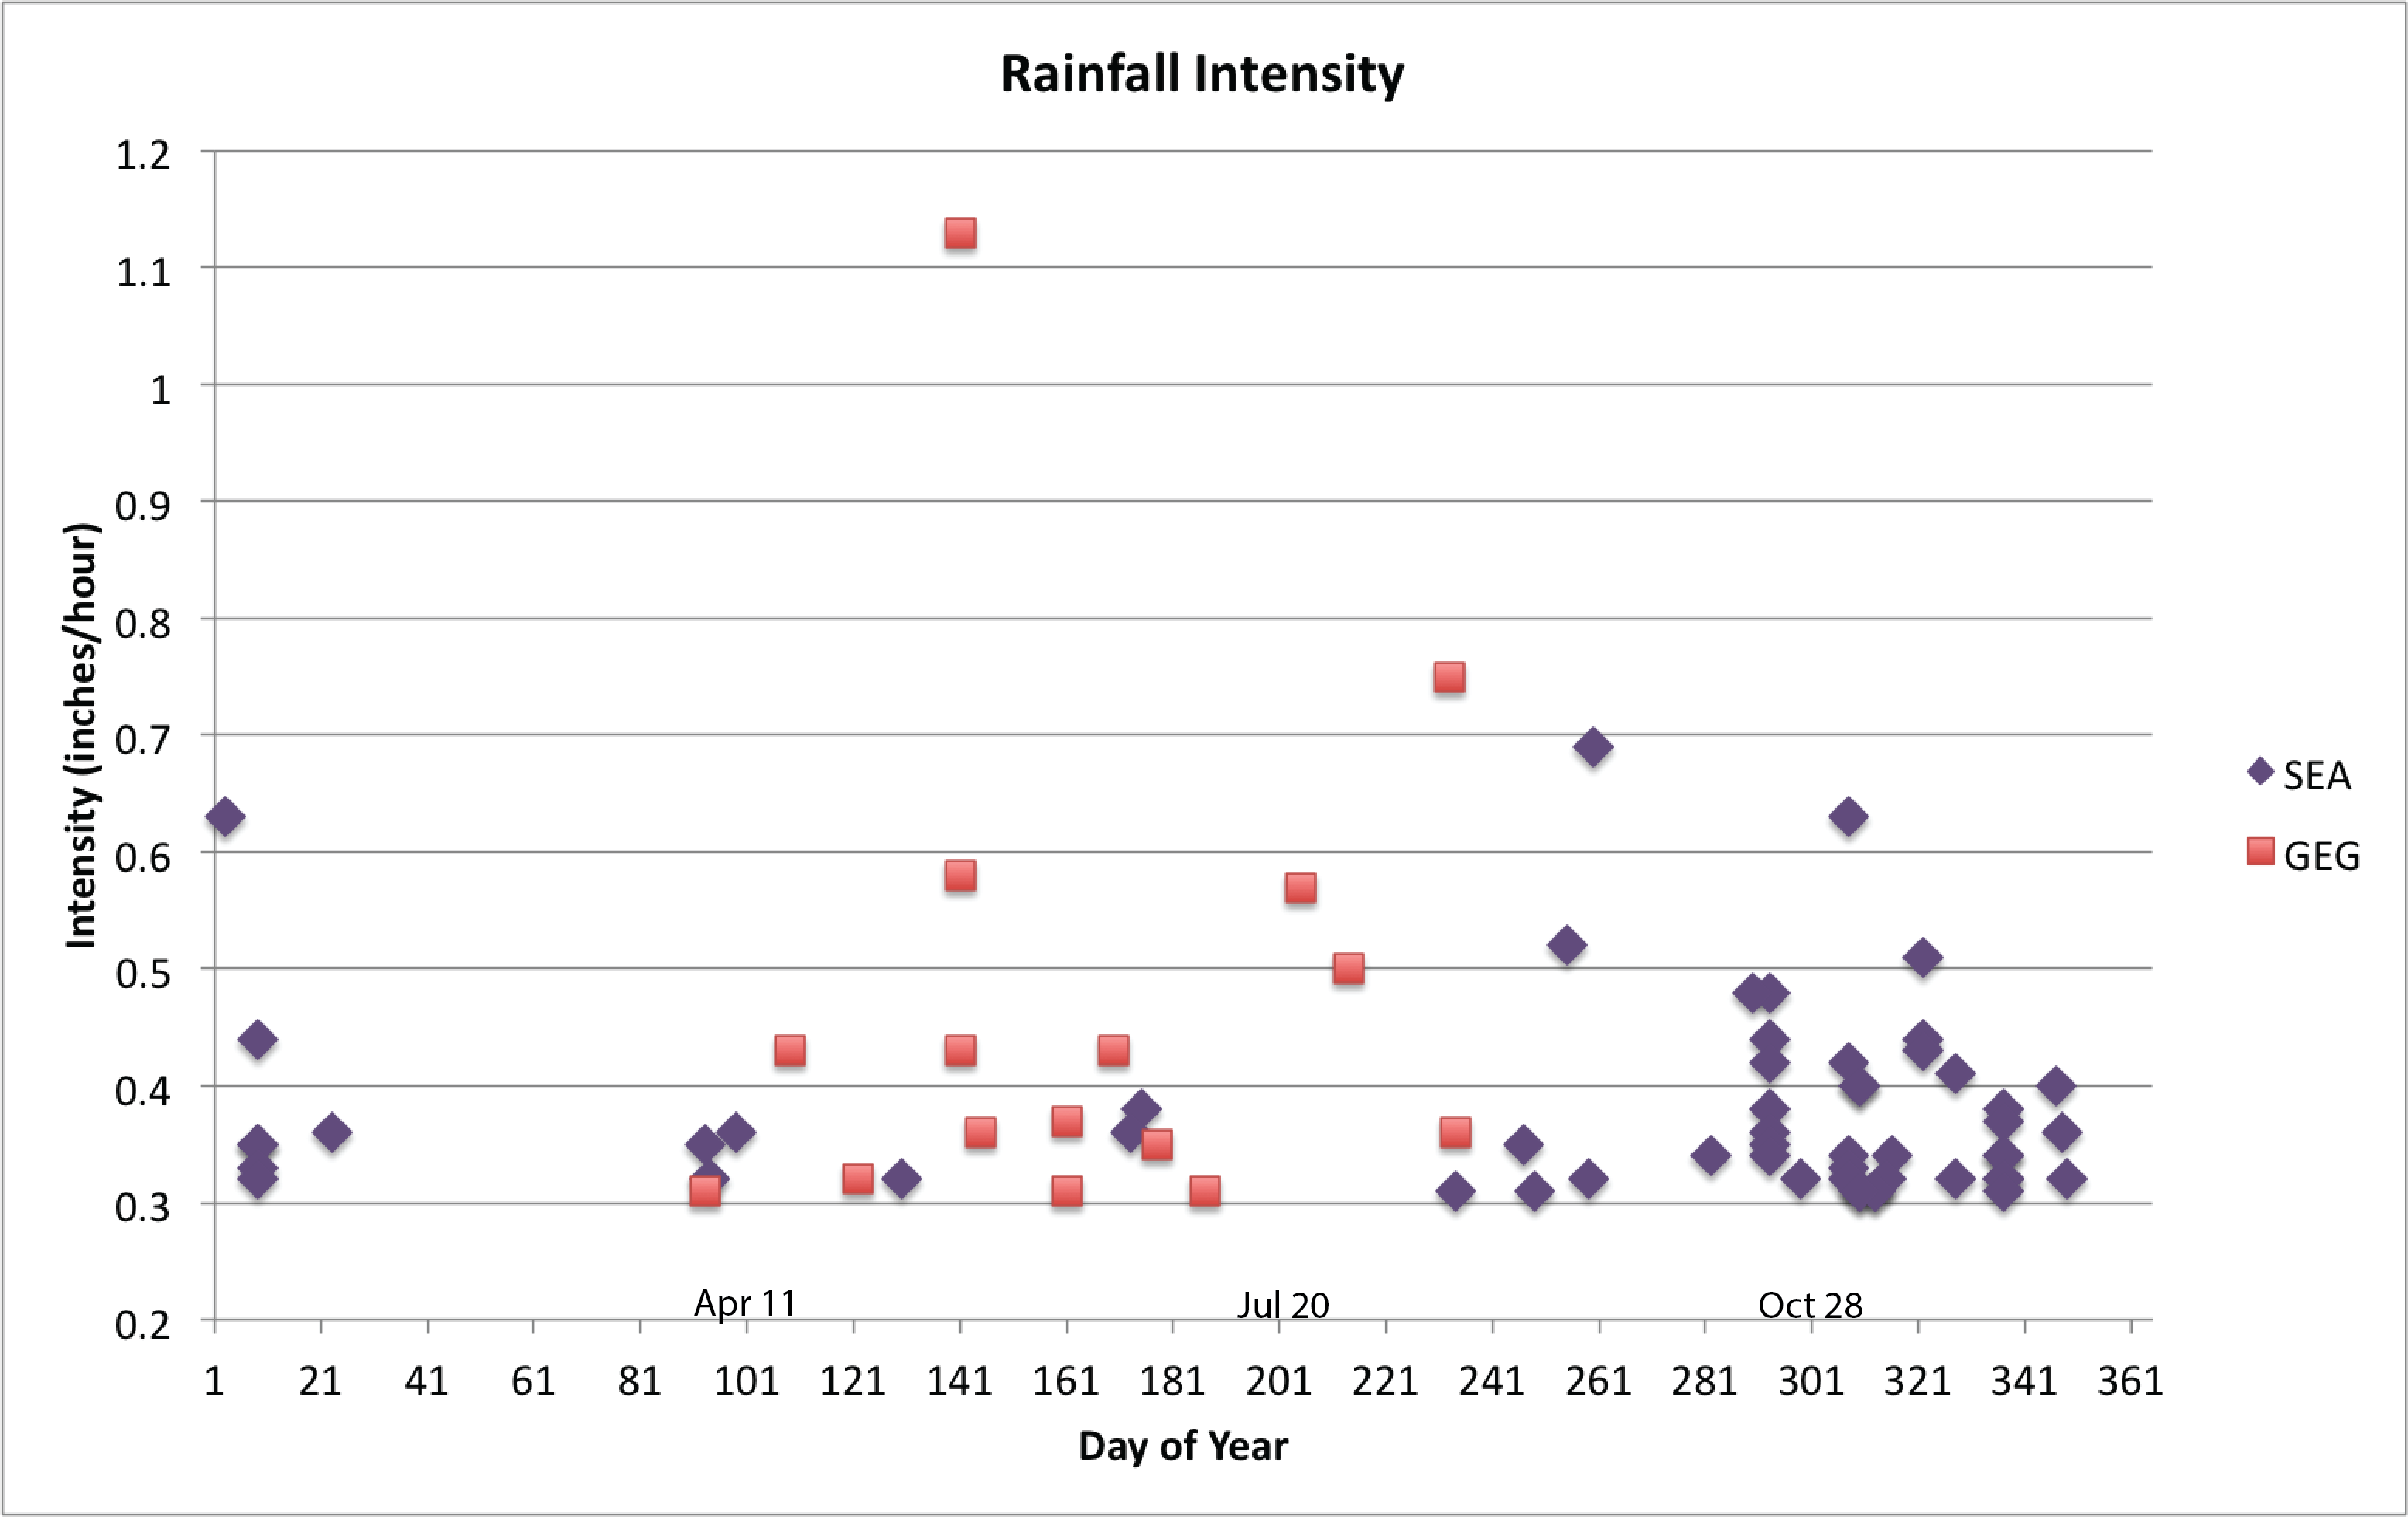 Figure 2: The day of year of intense precipitation events (greater than 0.30” per hour) from 1990 through 2010 at SeaTac Airport (SEA) and Spokane Airport (GEG). Note that most of the points that are vertically stacked on the graph are from the same event.
References
Church, P., 1974: Some precipitation characteristics of Seattle. Weatherwise, 27, 244-251.
Laskin, D., 1997: “Rains all the Time: A Connoisseur’s History of the Weather of the Pacific Northwest”, Sasquatch Books, Seattle, WA.