Review of 2012: Climatic Averages and the Top 7 Weather Events
With 2012 now completed, we would like to review the year from a weather and climate perspective. First, the climatic averages of 2012 will be presented, along with how this past year compares to other years. Second, we will review what OWSC considers the top 7 notable weather events of 2012.
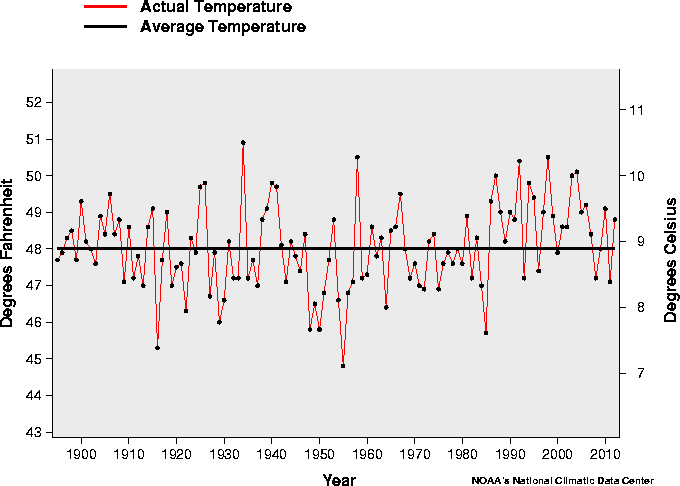
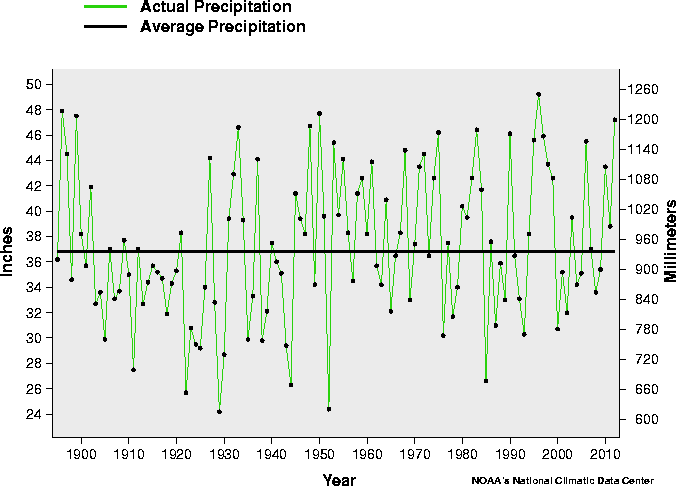
According to the National Climatic Data Center (NCDC), the mean temperature for 2012 averaged across WA State was 48.8°F, which is 0.8°F above the long-term 20th century average and 1.7°F warmer than 2011. Figure 1 shows the temperature time series for WA since 1895 from NCDC, where we can see that 2012 was in the middle of the pack in terms of statewide average temperatures since the turn of the century. The year was warmer than 7 recent years (2000, 2001, 2002, 2007, 2008, 2009, 2011) and colder than 5 years (2003, 2004, 2005, 2006, and 2010). But it was quite wet. The statewide average precipitation totaled 47.24” in 2012, which is 10.40” wetter than the long-term 20th century average and 8.48” wetter than 2011. In fact, 2012 actually ranks as the 5th wettest year statewide since 1895 and the wettest year since the turn of the century (Figure 2). The wettest year in the record was 1996 (49.20”), followed by 1896, 1950, and 1899.
But the interesting aspects of a year are often in the details (at least for weather enthusiasts!). Here we summarize the top 7 weather events of the year.
- January 16-19 snow and freezing rain – Almost the entire state was impacted by a spell of winter weather. Particularly hard hit was a region extending from southwestern WA into the southern portion of Puget Sound. Snowfall up to 18 inches was followed by as much as an inch of freezing rain. The result included about a half million power outages, building collapses, and over 300 flights cancelled at SeaTac Airport (the cost to Alaska Airlines alone was 3.5 million dollars). The eastern part of the state also received a one-two punch of snow and freezing rain, leading to slick roadways and numerous accidents. Fortunately, only a single fatality was attributed to this memorable storm.
- February 19 avalanches – There were three major avalanches on this day, two of which resulted in tragedy. An avalanche in the Tunnel Creek area just outside the Stevens Pass ski resort claimed the lives of three experienced backcountry skiers; an in-depth article on this event was published in the New York Times. Another avalanche near the Alpental Ski Area resulted in the death of a snowboarder. This day was a grim reminder that all that beautiful snow in the mountains must be treated with respect, and the backcountry enthusiasts should pay heed to the forecasts from the Northwest Weather and Avalanche Center (http://www.nwac.us).
- Cool and wet spring and early summer – This was a prolonged period of unusual weather rather than a short-term event but it sure got a lot of folks grumbling. It was especially rainy during March and June, setting monthly records for many weather stations around the state.The latter month included only 8 days for which the maximum temperature reached 70°F or higher at SeaTac (SEA) compared with an average of 12 days, and 14 days of measurable rain versus an average of 9. This weather was not restricted to the west side of the Cascade Mountains. Spokabe (GEG), for example, had only 3 days at 80°F and above and 12 days with measurable rain in June 2012, versus climatological normals of 9 and 8 days, respectively.
- July 16 and 20 thunderstorms – The rains of early summer in Washington went out with a bang, and that term is used literally. There was an unusual amount of thunderstorm activity in the first three weeks of July on the west side (including 4 separate thunderstorms in the Seattle area) but the real action was on the east side. Thunderstorms caused flash flooding and mudslides in Walla Walla County on 16 July. But that was just a tune-up for the hail, winds, and flash flooding that occurred on the 20th. Ferry and Okanogan counties were the hardest hit, with upwards of $10 million in costs due to downed power poles, road and bridge repair, and debris removal among other impacts.
- Late July through September dry spell – The rains stopped in the latter part of July 2012, and that is putting it mildly. SEA received only 0.03” of rain between 23 July and 12 October, and had the 2nd longest stretch of days without rain (48 days) on record. Eastern Washington was also remarkably dry. A number of locations (e.g., Wenatchee and Pullman) went over 80 days without any rain. One might think this was cause for celebration, but the dry weather meant an active wildfire season, as in many other portions of the western US. The Taylor Bridge and Barker Canyon Complex fires were particularly large, long-lasting, and costly. One of the many consequences of these fires was poor air quality, especially in Wenatchee among major population centers.
- Late fall/early winter rain and mountain snowfall – As befitting a year of see-saw weather, once the wet season began in October, there was no looking back. SEA had only 7 dry days from the onset of the rains on 12 October through the end of November. In terms of flooding, there were no extreme events, but many rivers in western Washington reached flood stage on 19 November. This meant copious snowfall in the high country. Particularly heavy snowfall in the Mt. Baker area helped produce a snowpack of 130” by 1 January (2013), which was tied for the greatest amount by that date since 1996-97.
- December 17 high water in Seattle – The sea level was the highest ever recorded in Seattle based on tide gauge measurements extending back to 1898. This dubious record was due to a combination of a very high astronomical tide combined with an extra 18-24 inches due to the low pressure and winds accompanying a moderately strong storm. Previous extreme sea levels in Seattle have coincided with El Niño (due to its effect on overall sea level along the entire west coast of the US) but El Niño cannot be blamed in this recent case.
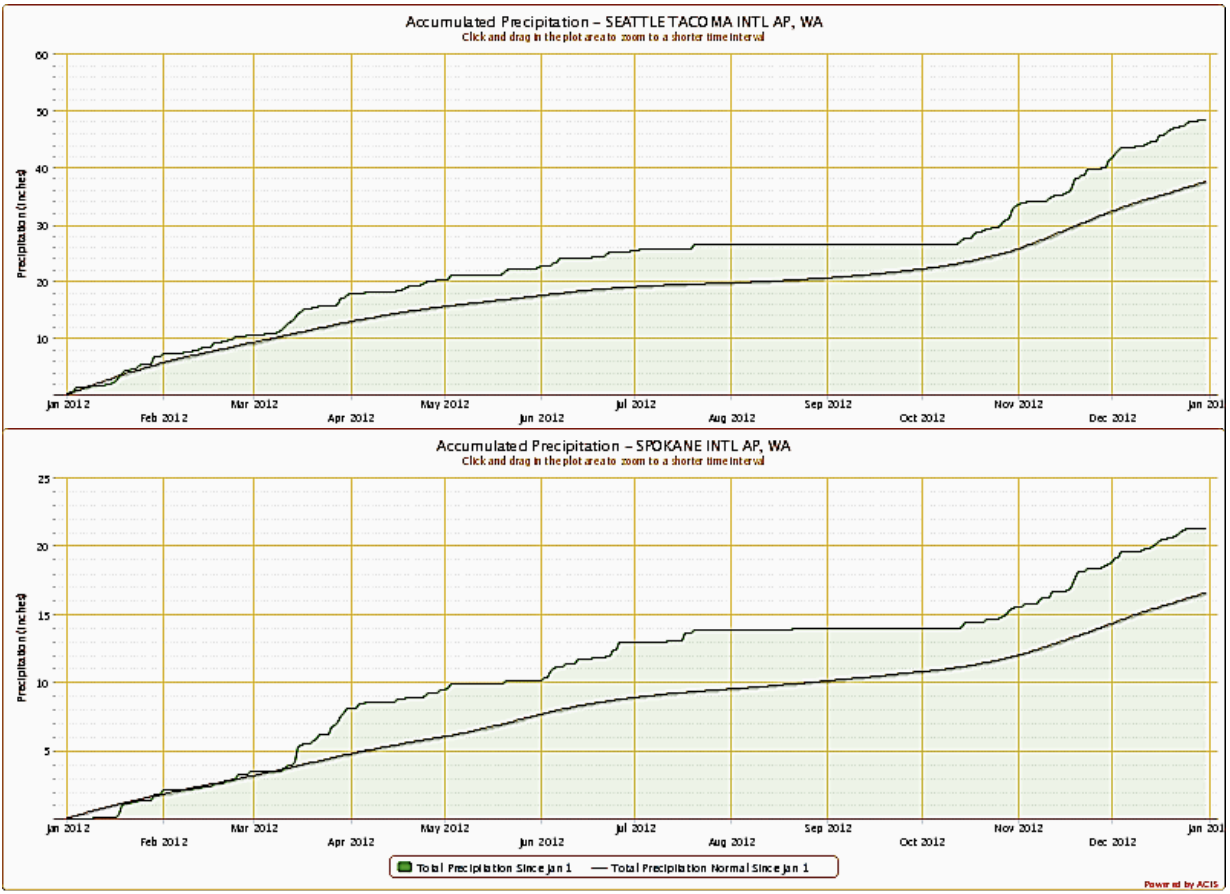
The dry and wet periods throughout the year are shown in the accumulated precipitation plots for SEA and GEG (Figure 3). Though we are not suggesting that the weather occurrences throughout 2012 were a result of climate change, it is interesting to note that the type of year we experienced is like one that regional climate prediction models have indicated for the future: specifically, drier summers and wetter falls, winters, and springs. The weather of 2013 has started off on the quiet side due to a prominent ridge of high pressure that set up along the west coast for a two-week period in January. Weather lovers fear not – there are 11 more months to go.