By Nick Bond
The most significant tornado outbreak in Washington State history occurred on 5 April 1972. Clark County was hit particularly hard, with an early afternoon tornado of F3 intensity causing 6 fatalities and injuries to 300 others. Later that same day, another F3 tornado struck Lincoln County, with fortunately only a single injury. Spring is known as the favored season for strong thunderstorms in many parts of the world. Is this the case for Washington? We experience fewer thunderstorms per unit area than any of the other lower 48 states so WA is not exactly a hotbed for convection (pun intended). That being said, there is a tendency for thunderstorms to occur more frequently from early spring into early summer in most parts of the state. It is also the time of year for our rare tornadoes, as discussed in Cliff Mass’ book “The Weather of the Pacific Northwest”. The purpose of the present contribution is to document how many tornadoes of F1 and stronger intensity have occurred during spring (April through June) since 1950, with separate consideration of those on the west and east sides of the Cascade Mountains. We are interested in determining how regional atmospheric conditions compare for west side versus east side tornadoes.
Data on the occurrence of tornadoes in Washington State for the years of 1950-2000 are available at www.tornadoproject.com, and for the years of 2000-2012 from the National Climatic Data Center’s Storm Events Database at www.ncdc.noaa.gov/stormevents. Our focus is on tornadoes of F1 and stronger intensities partly because of what appears to be underreporting of F0 events in the earlier record, at least relative to the more recent set compiled by NCDC. It is plausible that F0 events are more likely to be missed or misinterpreted because of their weaker winds. Moreover, it is the stronger tornadoes that generally have societal impacts. The events are itemized in Tables 1 and 2 for western and eastern Washington, respectively. The atmospheric conditions during these storms were assessed using 6-hour means from the NCEP Reanalysis. These storms were examined in an individual and a composite sense; the atmospheric variables considered were 500 hPa geopotential heights, winds and air temperatures, 700 hPa vertical velocity, 925 hPa air temperature and specific humidity, and sea level pressure. A sub-set of this information is included here.
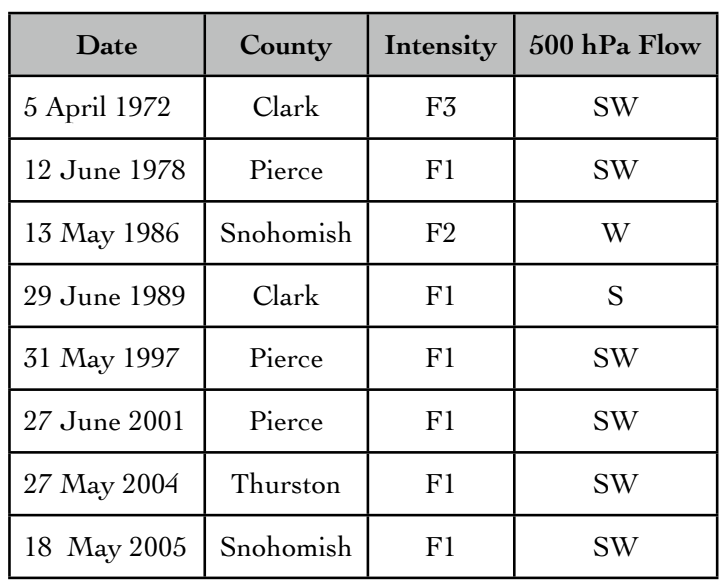 Table 1: Western WA tornadoes (F1 and stronger) during April-June.
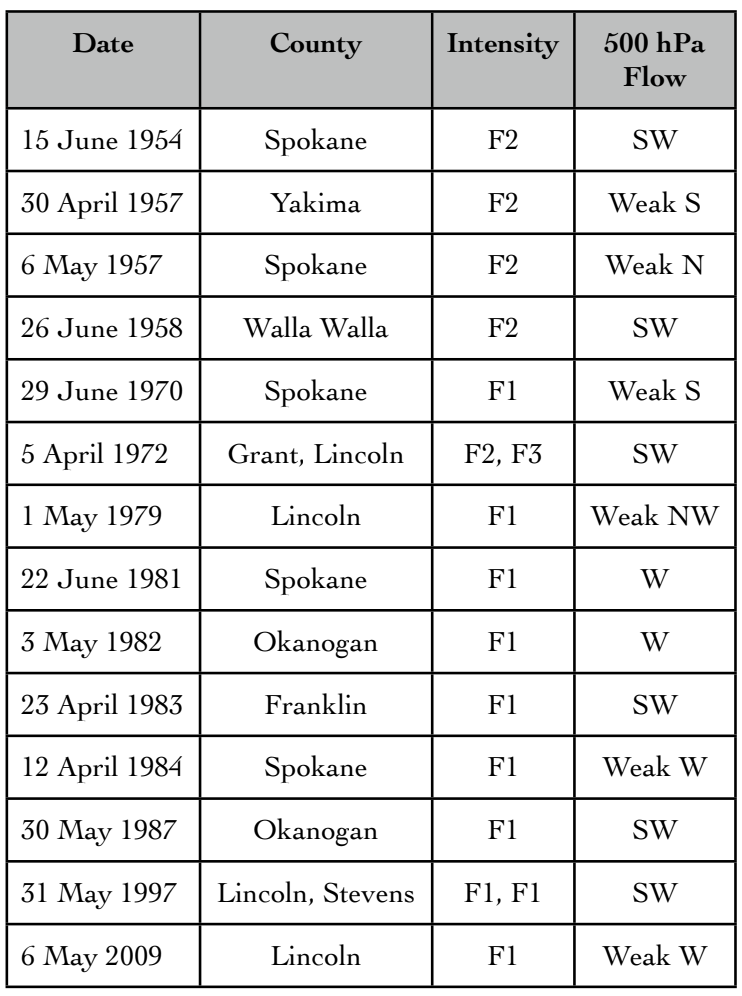 Table 2: As in Table 1, except for eastern WA.
A total of 8 events with tornadoes of F1 intensity and greater have occurred in April through June since 1950 in western Washington (Table 1); a total of 14 events have occurred during the same period east of the Cascade crest (Table 2). For the other three-quarters of the year, there have been 9 cases on the west side and 13 cases on the east side. This implies that these types of storms occur three times more frequently in spring, on average, compared with the remainder of the year in an overall sense. Tables 1 and 2 include a property of the regional atmospheric structure, specifically the sense of the flow aloft at 500 hPa (typically between 5 and 6 km). We were struck with the consistency in this flow among the cases comprising the western Washington tornadoes. Markedly less consistency was found for the eastern Washington cases. This result is borne out by composite maps for the vector wind at 500 hPa for the western cases (Figure 1a) and for the eastern cases (Figure 1b). The directions of the composite flow in the two sets are similar, but the magnitude is less for the eastern cases because of averaging out of the differences between individual events. There are also differences in the mean in the nature of the temperature profiles for the two sets of storms. For those on the west side, the atmospheric boundary layer (the lower layer of the atmosphere that is directly influenced by the surface) has been 1-1.5 C cooler than normal, as indicated in mean 925 hPa air temperature map shown in Figure 2a. This may not seem to make sense, but these cases do feature lower than normal static stability in that 500 hPa air temperature anomalies are even more negative (not shown). Moreover, while the atmospheric boundary layer is on the chilly side, it also includes positive specific humidity anomalies of about 0.5 to 1 g kg-1. The eastern WA tornadoes have occurred in an environment with boundary layer temperatures that are 0.5 to 1 C warmer than normal (Figure 2b), boundary layer humidity anomalies of positive 1.5 g kg-1, and 500 hPa air temperatures that are near normal. In other words, the convective instability is associated more with cool temperatures aloft for the western WA events, and warm and moist air at low levels for their eastern WA counterparts. Both the western and eastern tornadic events include low-level flow from the northwest in the mean. This was especially the situation for the eastern WA events, which was not expected. The backing in the winds with height means that our tornadoes tend to occur in conditions of cold advection, as opposed to the veering of the winds and warm advection that typically characterizes the environment for the supercell thunderstorms that spawn tornadoes east of the Rocky Mountains. The dynamical implications of this difference is well beyond our present scope but surely are manifested in a variety of ways. Finally, for readers interested in more about tornadoes in the Pacific Northwest, we recommend the aforementioned book authored by Cliff Mass, which includes maps showing their favored locations and a discussion of how they can form in association with the Puget Sound Convergence Zone.
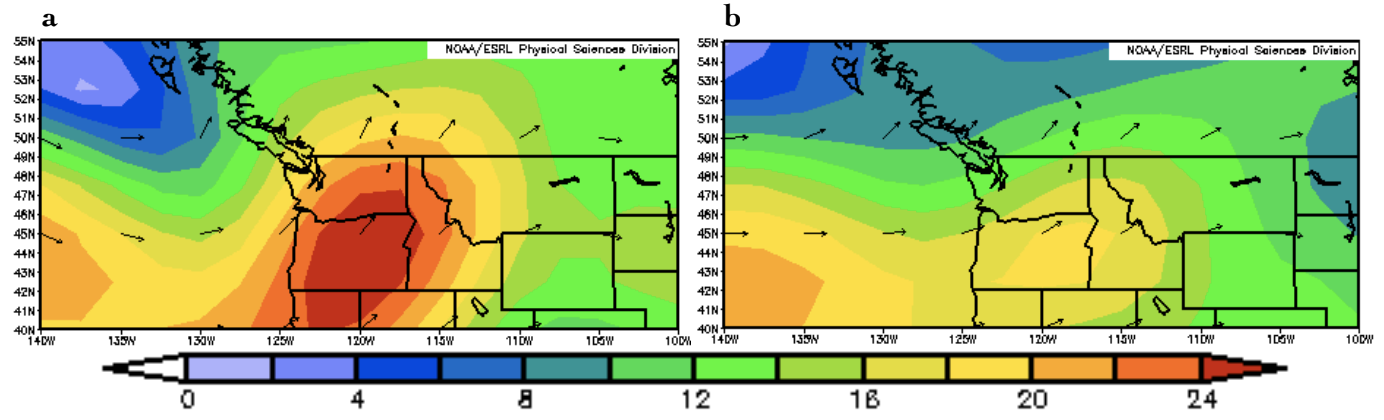 Figure 1: The composite mean 500 hPa winds for (a) the western WA tornadoes and (b) the eastern WA tornadoes (from ESRL).
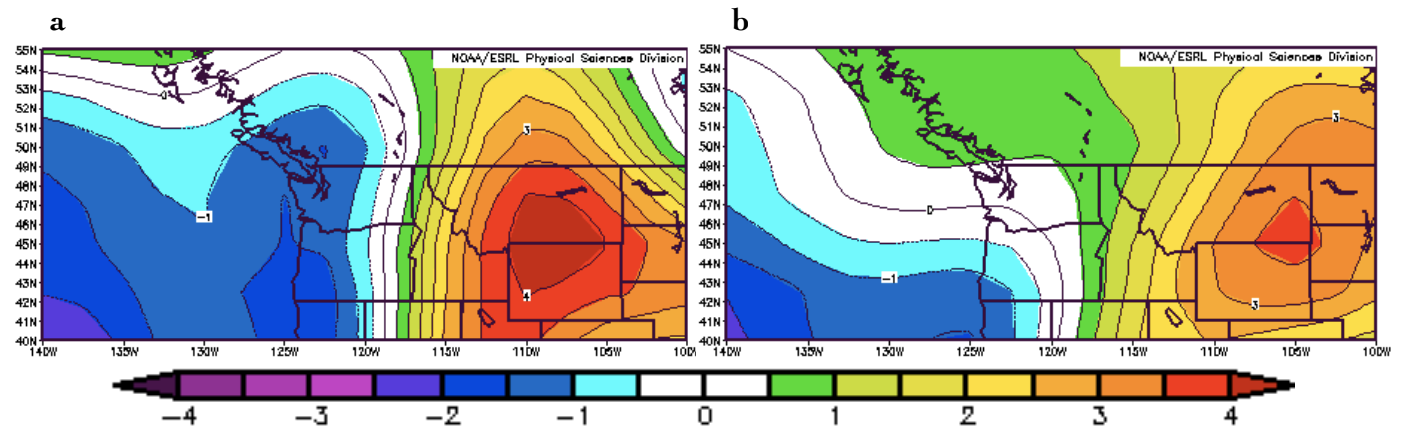 Figure 2: The composite 925 hPa air temperature anomalies for (a) the western WA tornadoes and (b) the eastern WA tornadoes (from ESRL).
Reference
Mass, C., 2008: The Weather of the Pacific Northwest, University of Washington Press, Seattle, WA.