By Nick Bond
The Intergovernmental Panel on Climate Change (IPCC) has produced a series of reviews of the state of the global climate and its expected changes. Portions of the Fifth Assessment Report (AR5) from the IPCC have been made available recently. In particular, a summary for policy makers and a draft report from Working Group 1 entitled “Climate Change 2013: The Physical Science Basis” were released on 27 September 2013. These publications represent the tremendous effort of hundreds of international scientists with a wide range of expertise, and involve an elaborate process of review and revision. The draft report from Working Group 1 runs more than 2000 pages; the technical summary alone exceeds 100 pages (available here: http://www.ipcc.ch/). We expect that most of the readers of this newsletter will not be plowing through the entire report and while any sort of summary we can include here could not possibly do it justice, we hope that providing a few tidbits might be appreciated. These excerpts pertain to both the global climate system as a whole, and the Pacific Northwest from a regional perspective.
In terms of the big picture, AR5 features the strong statement that warming of the climate system since the late 19th century is “unequivocal”. An interesting wrinkle here is that the warming of the ocean accounts for more than 90% of the increase in energy stored in the atmosphere-ocean climate system since 1970. The state of the cryosphere (i.e., snow, ice sheets, glaciers, etc.) has received considerable recent attention, and there is high confidence that over the last two decades there have been declines in the mass of the Greenland and Antarctic ice sheets, shrinkage in glaciers in a global sense, a decrease in Arctic sea ice during summer, and less snow cover in the Northern Hemisphere in spring. Projections of the future climate rely primarily on the output from global climate models. It is asserted that these models have been improved since the last report (AR4). That being said, while they are able to reproduce observed temperature patterns on continental scale they are not as capable with respect to precipitation. On the topic of precipitation, projected changes in the water cycle will be far from uniform, with a consensus of the models suggesting increases in general at higher latitudes and mostly decreases in already dry regions in the sub-tropics. The expected rises in sea level will occur at a greater rate than indicated in AR4 due to better account of contributions from glaciers and ice sheets. While there is substantial uncertainty in the rate of warming over the next century, the eventual total response with respect to global mean temperatures will be determined by the cumulative emissions of greenhouse gases.
A hot topic is the hiatus in global warming over the last 15 years (pun intended). In more concrete terms, the linear trend in global mean surface temperatures over that period was only about 1/3 to 1/2 of the trend for 1951-2012 as a whole. The recent weakening in the warming of the global climate (which was also manifested in the Pacific Northwest) was poorly simulated by the present generation of global climate models. AR5 attributes this discrepancy to a combination of internal variability, improper handling of the radiative forcing and other errors due to the models being too sensitive (by about 10%) to greenhouse gases, and other anthropogenic effects. It will be interesting, of course, to see how long this hiatus continues.
The model projections for the PNW indicate the likelihood of an increase in winter precipitation, and a decrease in summer precipitation, with a weaker consensus for the latter (Figure 1). The model results may be resolution-dependent, as illustrated by the differences found in an ensemble of runs from a single higher resolution model (right panels of Figure 1). There is very little to go on with regards to any systematic changes in regional storm tracks (i.e., wind storms) in next few decades. A poleward shift in the storm track is more likely than not over the North Pacific by the latter half of the century. It is a good bet that there will be increases in the temperatures accompanying both heat waves and cold snaps. But our ability to project changes in frequency and magnitude of extreme events is limited because of shortcomings in the models’ ability to simulate changes in key features of the circulation such as blocking. The various climate models used by IPCC have different historical climatologies in terms of blocking frequency vs. longitude (Figure 2). This matters to WA State because during winter for example, blocking at 130 W (230 E) usually means dry, stagnant conditions while blocking at 150 to 160 W (210 to 200 E) is often accompanied by the delivery of cold air out of Canada. Many of the models do not replicate the observed climatology of blocking particularly well, which may compromise their projections of changes in blocking and other sorts of high-amplitude circulation features associated with extreme events in all seasons.
In closing, we would like to make a point we have made before, and that we feel is worth making again. It relates to the issue of the recent hiatus in warming brought up above. The intrinsic variability of the climate is substantial, especially for any particular region. This source of variability is liable to dominate the climate signal in the Pacific Northwest over the next couple of decades.
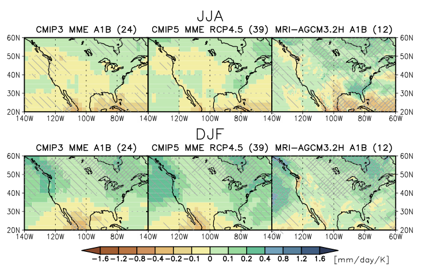 Figure 1: Changes in precipitation from the period of 1986-2005 to the period of 2080-2099 from ensembles of 24 CMIP3 models (left), 39 CMIP5 models (middle), and 12 members of the 60 km mesh MRI-AGCM3.2 model (right). All changes are normalized by the global mean temperature change in each scenario. The hatched lines show statistical significance. Adapted from Figure 14.8 from Chapter 14 of Working Group 1 (AR5).
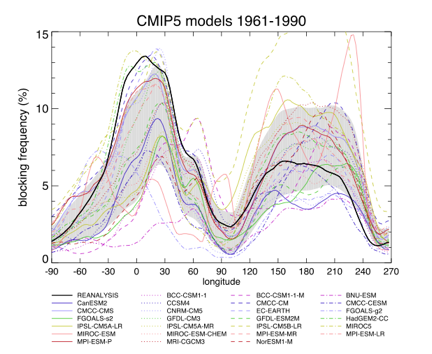 Figure 2: Annual mean blocking frequency in the Northern Hemisphere for the period of 1961-1990 as simulated by a set of CMIP5 models (color lines), and as derived from
the NCEP Reanalysis (thick black line). Gray shading shows model mean plus and minus one standard deviation. Adapted from Box 14.2, Figure 1 from Chapter 14 of
Working Group 1 (AR5).