By Nick Bond
We have previously discussed the skill of seasonal weather predictions for winter in this newsletter (March 2014 edition). One of the most important sources of information for these seasonal forecasts is the future state of El Niño-Southern Oscillation (ENSO). An ENSO warm event (El Niño) seems likely for the upcoming winter, as indicated in the set of predictions from modeling centers around the world shown in Figure 1. This El Niño is taking its sweet time in development, and so how much should we trust these kinds of predictions?
Considerable effort has gone into assessing the skill of present-generation ENSO models. A recent review of the topic is provided by Barnston et al. (2012); some excerpts from that paper are reproduced below. Once formed, the maintenance of an El Niño or La Niña event is reasonably well understood. Air-sea interactions in the tropical Pacific are crucial, with mutual reinforcement between the atmospheric and oceanic anomalies. On the other hand, we have much less understanding of the mechanism(s) that kick ENSO from one state into another. This is reflected in the diversity in the statistical models for ENSO prediction, which key on different variables in the atmosphere-ocean system. The dynamical models are more alike in principle, but nevertheless generally yield a range of forecast trajectories, as in the example shown in Figure 1.
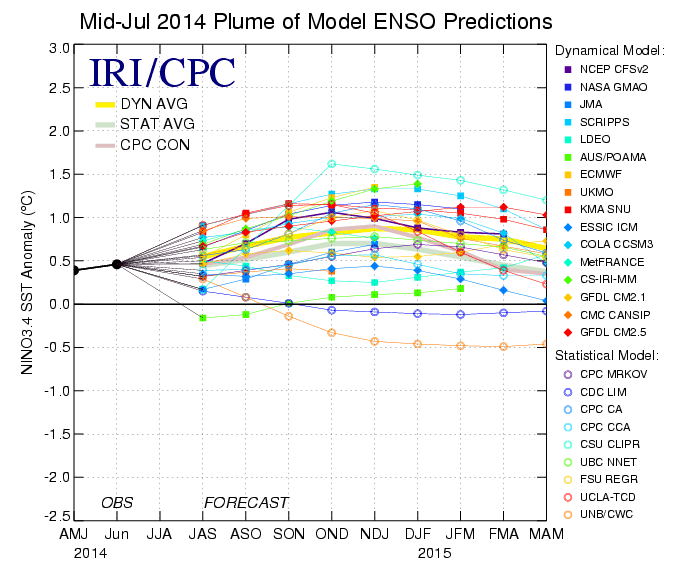 Figure 1: Time series of sea-surface temperature anomalies in the Niño3.4 region from a variety of statistical and dynamical prediction models as of mid-July 2014. [From IRI/CPC]There are various ways to quantify forecast skill. One measure commonly used is the root mean square error (RMSE), which relates to the average magnitude of the deviation between the values predicted by a model relative to observed values. The average RMSE as a function of lead time for a variety of ENSO models is shown in Figure 2 (from Barnston et al. 2012). These results are for the period of 2002 through 2011, and there will be more about this later. The lower the RMSE the better, and values up to about 1 indicate useful skill. This threshold is reached on average at ~6 months for most of the models tested. There is a marked seasonal dependence in the performance of these models, with forecasts initiated in the northern hemisphere summer (winter) tending to be more (less) skillful, especially for lead times exceeding a couple of months.
The predictability of ENSO also varies on multi-year time scales. As shown in Figure 3 (also lifted from Barnston et al. 2012), 2002-2011 was a period of relatively low predictability, with smaller correlations between model ENSO predictions and observations than during much of the period of model validation. This relates to the weak amplitude of ENSO during that same period (lower panel of Figure 3). Since predictability was low in 2002-2011, perhaps the results shown in Figure 2 reflect the lower limits on model skill.
The consensus of the models is that there will be an ENSO during the upcoming winter that will be strong enough to impact the global-scale atmospheric circulation. Of course, we do not know how it will play out exactly in terms of the weather of our region, but we’ll be watching.
 Figure 2: A time series of correlation between model predictions and observations with a 3-year moving average for 14 models (top). The thick lines represent the correlations for 3-month lead times; the thin lines are for 6-month forecasts. The black lines represent multi-model averages. The standard deviation of the sea-surface temperature anomalies for the same sliding 3-year
periods is shown in the bottom panel. [From Barnston et al. 2012]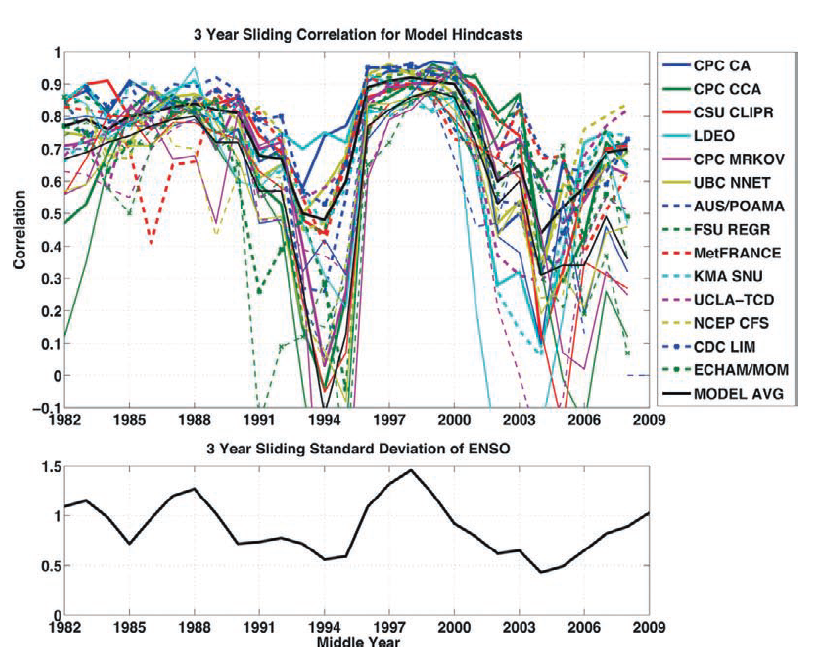 Figure 3: A time series of correlation between model predictions and observations with a 3-year moving average for 14 models (top). The thick lines represent the correlations for 3-month lead times; the thin lines are for 6-month forecasts. The black lines represent multi-model averages. The standard deviation of the sea-surface temperature anomalies for the same sliding 3-year periods is shown in the bottom panel. [From Barnston et al. 2012]
References
Barnston, A.G., M.K. Tippett, M.L. L’Heureux, S. Li, and D. G. DeWitt, 2012: Skill of real-time seasonal ENSO model predictions during 2002-11 – Is our capability increasing? Bull. Amer. Meteor. Soc., 93, 631-651.