By Nick Bond
California is desperate for water. Precipitation totals in the Golden State have generally been sub-par since the late 1990s, with last winter being especially extreme (the third driest in the record extending back to 1896). While they are hurting, the Pacific Northwest needs its water too, which raises the following question: Is it a case of us versus them? Readers of this newsletter may already know that there is a sort of yin-yang in wintertime precipitation along the west coast in association with El Niño-Southern Oscillation (ENSO). A weak El Niño is liable to be in the cards. The sea surface temperature is quite warm in the central and eastern tropical Pacific Ocean, but to date, there has been little response in terms of the deep cumulus convection. If El Niño finally gets its act together, and the movie stars get to fill their swimming pools, does it mean we are probably doomed to less lowland rain and meager mountain snow packs?
To address that question we have considered the historical record over the past 65 years. The precipitation at SeaTac Airport (SEA) for the months of October-March each year is used as a measure of cool season precipitation for Washington state. These totals have been compared with their counterparts at various locations along the west coast. It should come as absolutely no surprise that the seasonal totals at SEA correspond closely with the totals at nearby locations such as Portland (PDX). Here the focus is on California, and the seasonal totals at Los Angeles (LAX) and San Francisco (SFO) are used for that purpose. This data was gleaned from the “Climate at a Glance” website maintained by NOAA/NCDC ( http://www.ncdc.noaa.gov/cag/time-series).
First, it seems worthwhile to examine the mean atmospheric circulation pattern associated with precipitation in Washington state. As commonly done in this corner, we characterize the circulation by way of the 500 hPa geopotential height (Z). Figure 1 shows the distribution of the correlation coefficient between the seasonal mean 500 hPa Z and precipitation at SEA. This pattern indicates that wet (dry) winters tend to be accompanied by relatively low (high) 500 hPa Z values over southeast AK with values in the opposite sense to the south along about 30 N across the eastern Pacific into the southwestern US. In other terms, westerly (easterly) anomalies in the flow aloft are associated with wet (dry) winters in our backyard. The overall pattern resembles, but does not closely match, the 500 hPa Z associated with the Pacific North American (PNA) teleconnection pattern (not shown). The PNA features “centers of action” or poles in the central North Pacific and Gulf of Alaska/western Canada that are shifted about 20 degrees longitude to the east, and an overall magnitude about 1.5 times greater than that shown in Figure 1. While the PNA corresponds with the weather of the Pacific Northwest, that its pattern does not match Figure 1 provides a good example that a single climate index is often insufficient for characterizing the state of the circulation for a region.
The relationship between seasonal precipitation totals at SEA versus LAX and SFO in California are summarized in terms of the scatterplot shown in Figure 2. Wetter winters at SEA tend to be accompanied by drier winters at LAX, and vice versa, with plenty of scatter. But there is virtually no relationship between the precipitation anomalies at SEA and SFO. Referring back to Figure 1, when it is wet at SEA higher 500 hPa Z and NE flow anomalies are favored over LAX, which is unfavorable for precipitation. It is a more of a mixed message for SFO, however, which experiences slightly higher 500 hPa Z but also westerly flow anomalies, with the apparent result of little net effect on precipitation.
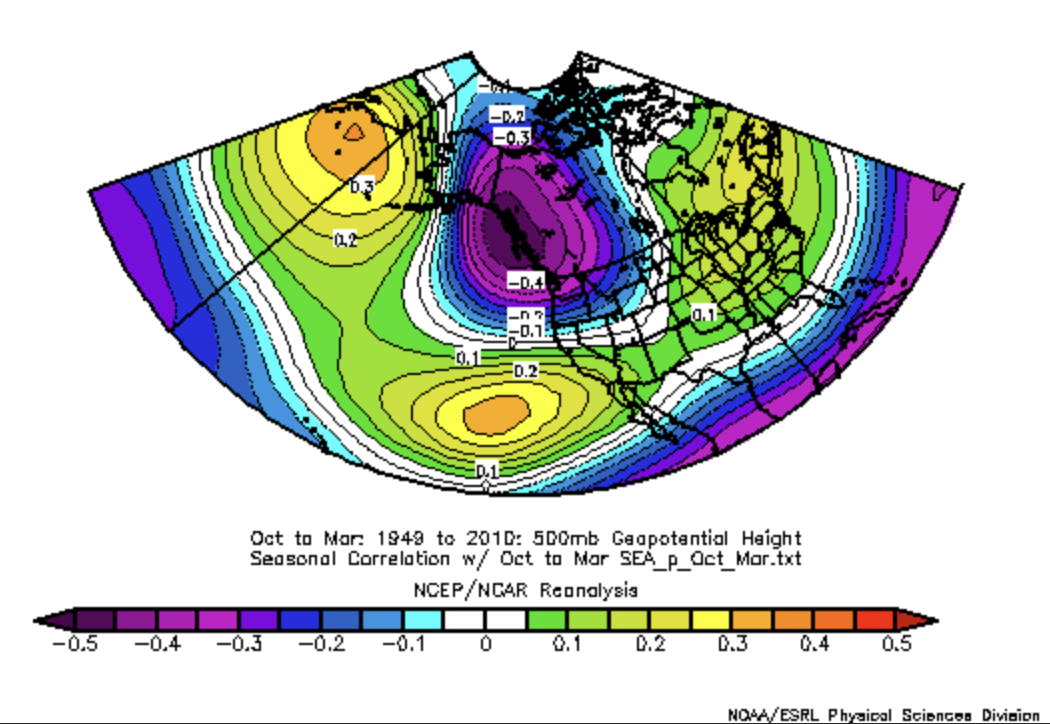 Figure 1: Distribution of correlation coefficients of 500 hPa geopotential height with total precipitation at SEA during October through March (from ESRL).
There are some interesting details in Figure 2. The driest year at SEA by a large margin was 1976-77, and this winter was also quite dry for California and especially the northern part of the state including SFO. The winter of 1997-98 was the wettest of the period considered here at both LAX and SFO. In second place at SFO was the winter of 1982-83, which happens to be the wettest for the state of California as a whole in the record extending back to 1895. Those two winters included greater than normal amounts of rainfall for SEA, and the Pacific Northwest in general (especially 1982-83). A key point is that these winters featured extremely strong El Niño events. There are too few of these extreme events to say anything definitive, but it is plausible that they have different effects on the seasonal weather of western North America than more run-of-the-mill ENSO events.
The bottom line is that indeed while there is some tendency for the winter precipitation anomalies in Washington state and at least southern California to be of the opposite sense, there have been plenty of winters with enough juicy Pacific storms to go around. Who knows, maybe this one will be one of those cases.
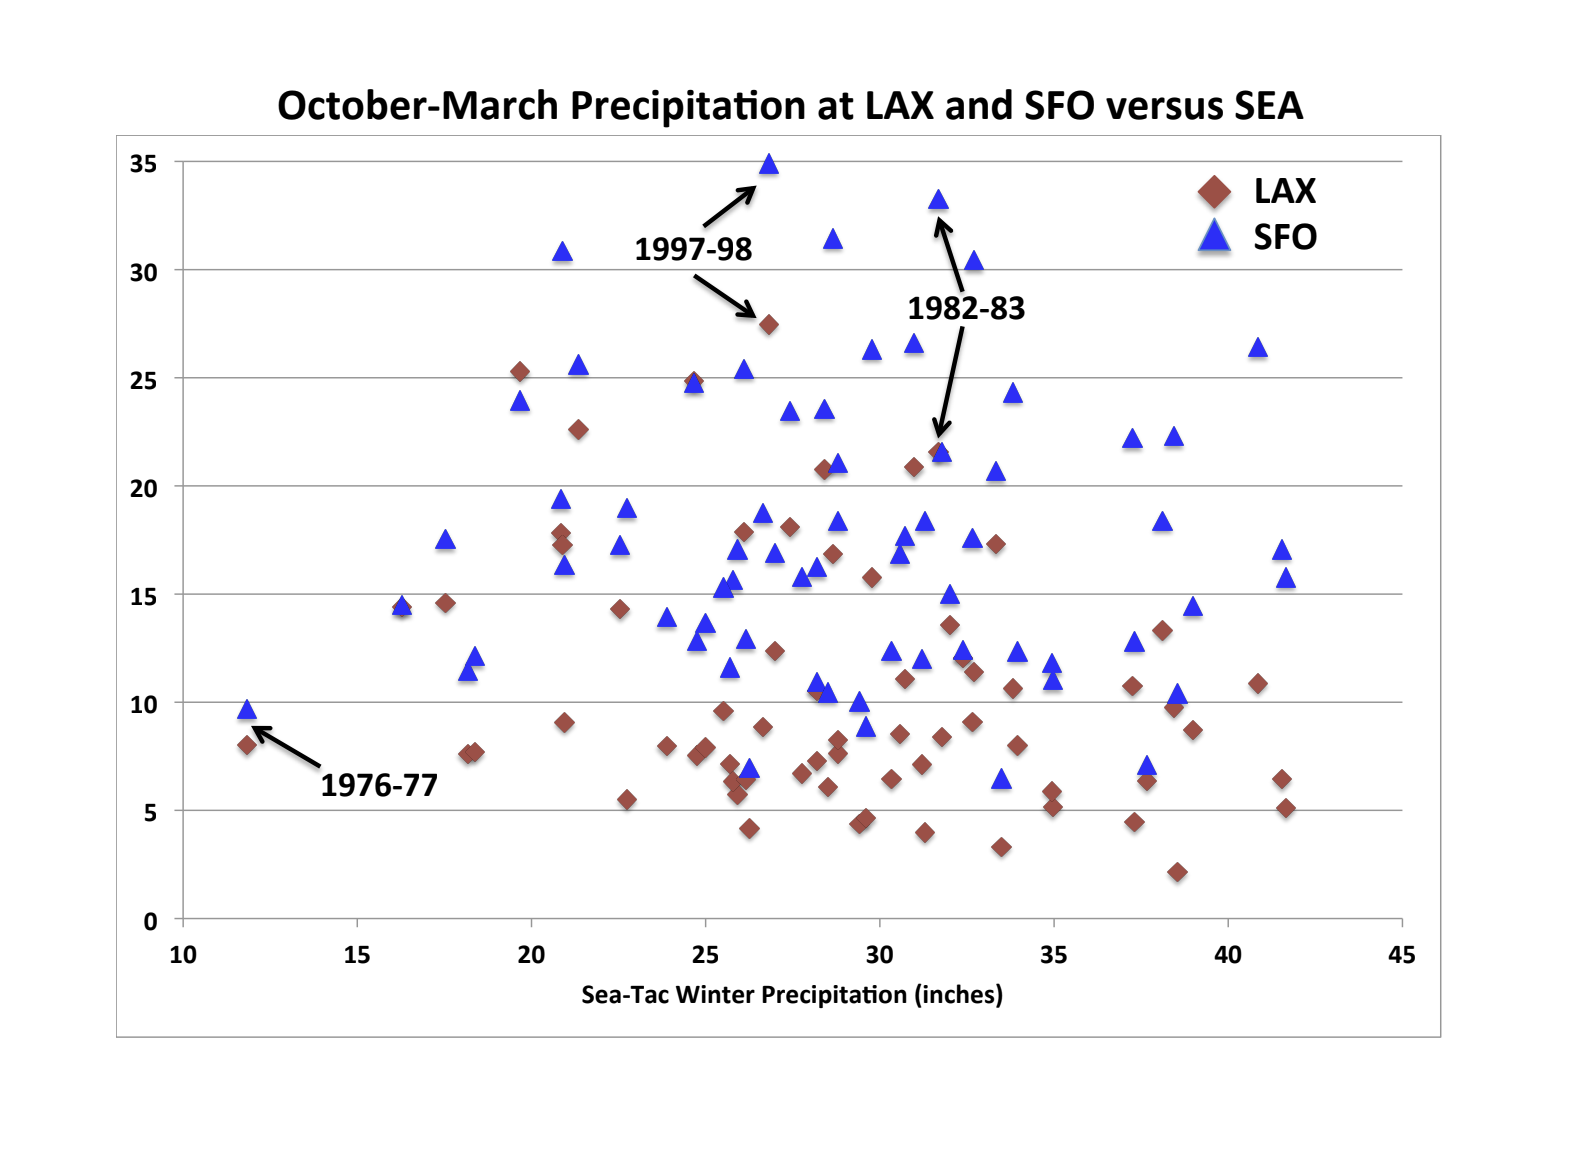 Figure 2: Scatterplot of October-March precipitation (inches) at LAX (red diamonds; y-axis) and SFO (blue triangles; y-axis) versus SEA (x-axis) for 1948-49 through 2013-14.