Extreme Precipitation Events in Washington State during the month of May
One year ago (May 2014), this newsletter included a piece on the historical record of extreme short-term precipitation events in Washington state, with a focus on whether there were any noticeable trends in the frequency and intensity of these event. The previous piece considered the top ten 1-day precipitation events at a variety of stations west and east of the Cascade Mountains for a cool season defined as October through April, and for a warm season defined as May through September. The two seasons were considered separately since the weather patterns promoting heavy precipitation events tend to be quite different during the different times of year. But in some ways this division is arbitrary. In particular, the month of May can include both winter-like and summer-like weather. So we thought it might be interesting to delve into the largest 1-day precipitation events during just the month of May. The objectives here are to see if the record indicates any meaningful trends, and to document the typical synoptic weather situations associated with heavy May rains on the west and east sides of Washington state.
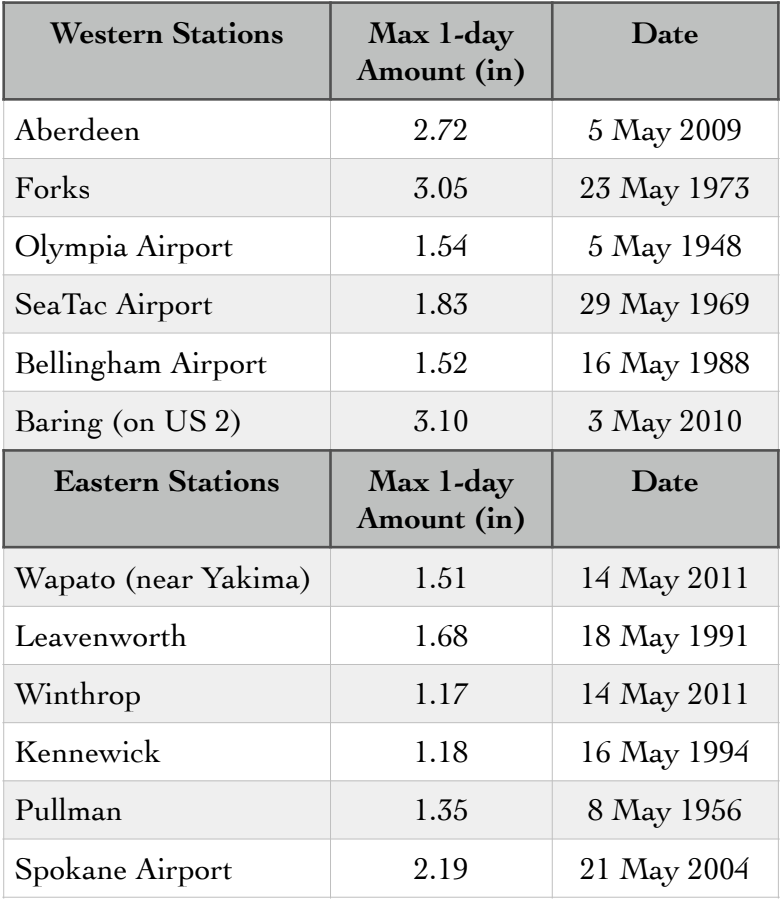
The results shown here are based on daily values of precipitation from station data; 6 stations each in western WA and eastern WA representing different parts of the state. The stations have relatively complete records of daily precipitation data back to 1945 and were picked for their geographic coverage. Mountain foothills stations were included in both the western group (Baring) and the eastern group (Leavenworth and Winthrop). Table 1 itemizes the amounts and dates of the record 1-day precipitation at the twelve stations for the month of May. We were struck by how much it can rain in a day in eastern Washington.
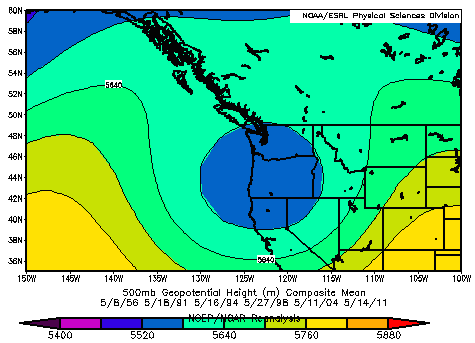
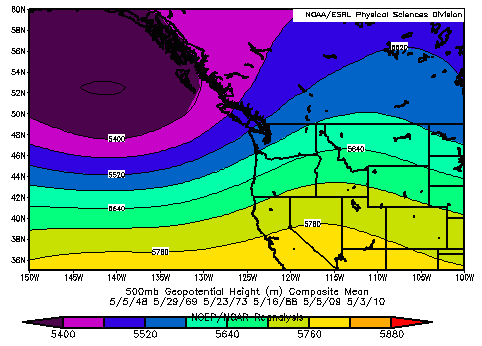
But does that mean that the circulation patterns associated with the heaviest rains in May are similar on the two sides of the Cascade Mountains? The regional distributions of 500 hPa geopotential height (Z) and sea level pressure were examined for each of the days in Table 1, and it became apparent that much different set-ups occur during the rainiest days in western versus eastern Washington state. A composite 500 hPa Z map for the 6 western cases (Figure 1) shows a winter storm pattern with moderate-strong westerly flow. Relatively minor differences were found among the individual cases. The composite 500 hPa Z map for 6 eastern cases is shown in Figure 2. This composite includes 27 May 1998, during which Winthrop received its second highest total of 1.10”, to the 5 days listed in Table 1 because the event of 14 May 2011 constituted record amounts at both Wapato and Winthrop. The 500 hPa Z distribution for the eastern cases is very different. These cases are typically associated with an upper-level low near the coast and weak southeasterly flow over eastern Washington. One of the cases in this composite was kind of an oddball; 2.19” rain fell in Spokane on 21 May 2004 with weak northwesterly flow at 500 hPa. Thunder was reported during this event, and in general, the pattern for the eastern cases is much more akin to that associated with summer thunderstorms than the winter-type disturbances that cause the heaviest May rains on the west side.
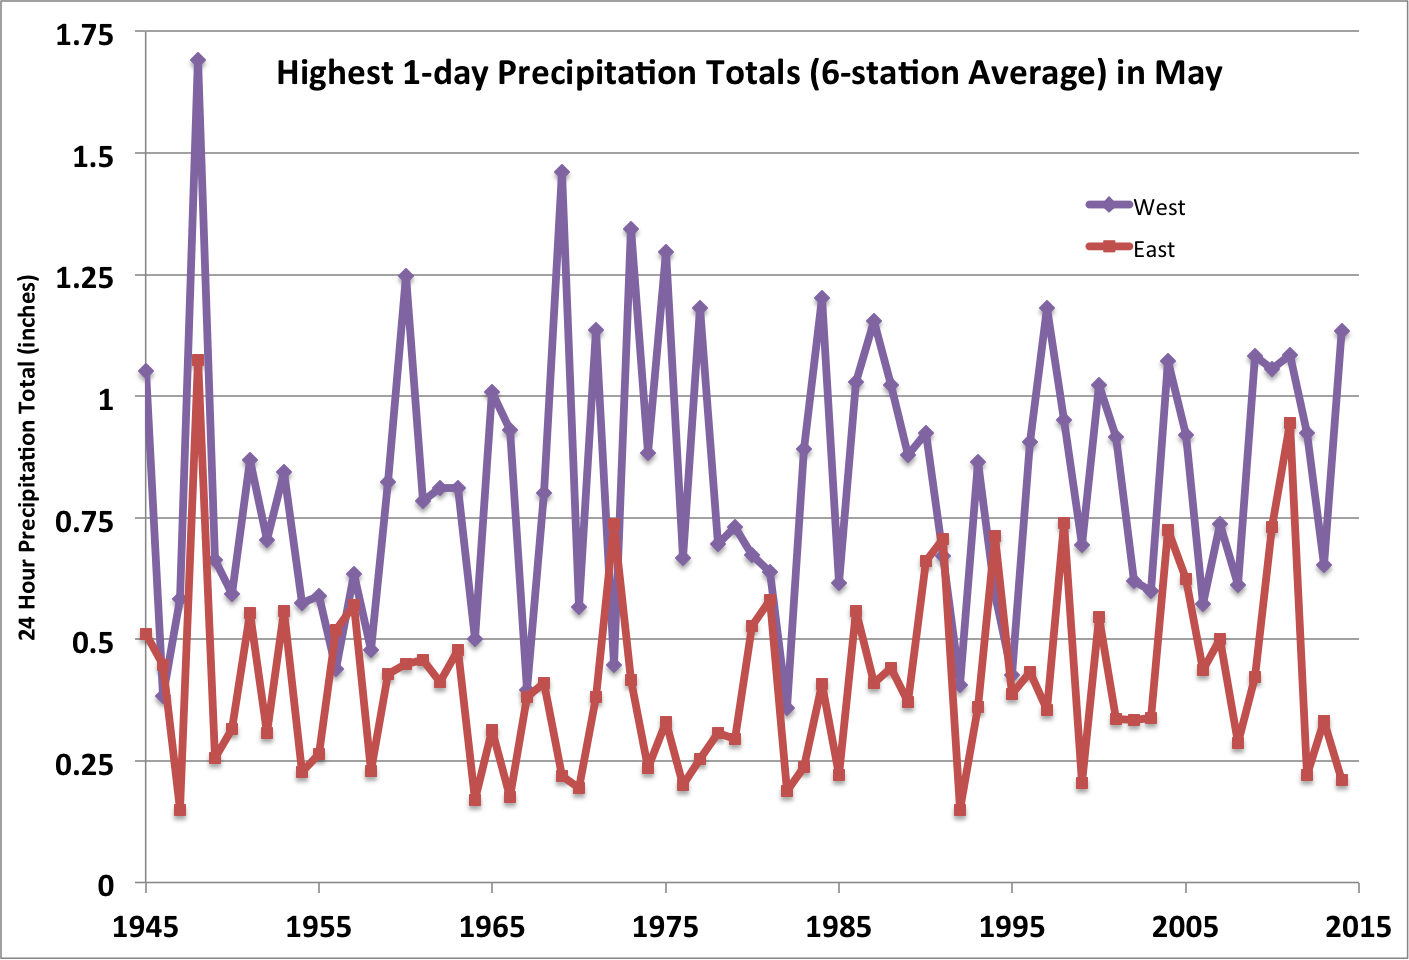
The trends in the intensities of the heaviest May rains were assessed in the following manner. We again considered 1-day precipitation amounts during May for the same sets of 6 western and 6 eastern stations. The top values during each May from 1945 through 2014 was determined for each station and used to form 6-station averages, yielding representative measures of the greatest 1-day rain of the month for the two sides of Washington state. The time series of these averages for the western and eastern stations are shown in Figure 3. Our interpretation of these time series is that there is no discernible trend in the intensity of May rains in western Washington. There may be a slight tendency for heavier May rains in eastern Washington; the frequency of years with relatively high values has been greater since roughly 1990. We recognize that our analysis is far from comprehensive. Nevertheless, both the results shown here, and monthly precipitation records (as can be explored with the featured application on the OWSC web page: http://www.climate.washington.edu/trendanalysis/ ) indicate that year-to-year variations are dominating secular changes in the precipitation in Washington state.