By Karin Bumbaco
With the topic of drought the focus of numerous local and national news stories of late – whether it’s the current Pacific Northwest (PNW) drought, the devastating multiyear California drought, or the torrential, drought-ending rains in Oklahoma and Texas – it is a good time to review a paper published in 2010 by current and former OWSC staff on different “flavors” of drought in the PNW. Bumbaco and Mote (2010) describe three of the many ways drought can develop in the PNW using 3 recent case studies, and describe the various impacts on sectors that the droughts had in the past. This highlight will review some of the general findings of that paper, and compare the WA drought this year with that of 2005.
Bumbaco and Mote (2010) used the water years (Oct through Sept) of 2001, 2003, and 2005 to illustrate 3 flavors of drought in WA State. The first, in 2001, resulted in low winter snowpack caused by low winter precipitation, and had most of its impacts in the spring and summer. In addition to the generally low streamflow in the winter (Dec-Feb), the snowmelt dominated streams in the state (mostly in eastern WA) had streamflows during summer (June-September) that ranked among the 5 lowest in 55 years. Loss of revenue from hydropower was approximately $3.5 billion in WA State alone, and caused increases in electricity rates of 10-58%. The second flavor of drought – the dry summer drought – occurred in WA in the summer of 2003 as result of the second warmest and second driest (at the time of journal publication) Jul-Aug for WA and OR combined. Even though summers are typically dry in the region, there were additional consequences including record or near-record low flows during the Jun-Sept period for streams that are not snowmelt dominated. Fire season was also particularly bad in OR and British Columbia, but WA was mostly spared. The last flavor of drought – and the one that is particularly relevant to the drought occurring currently – was in 2005. Warm winter temperatures decreased snowpack, leading to both winter and summer drought. WA Cascade precipitation was between 70 and 80% of normal during the winter, but snowpack was only 20% of normal for much of the winter. Early season storms were accompanied by such warm temperatures that snow water content declines were observed even at the highest locations monitored.
The 2005 “flavor” of drought is the most similar to what has occurred this season, and the last statewide drought declaration before this year occurred in early March 2005. But there are also some differences. Figures 1 and 2 show the monthly statewide average temperature and total precipitation for the 2005 and 2015 water year along with the 20th century average. Temperatures in Jan through March for the 2015 water year were much warmer than those in 2005 (Fig 1). February, for example, was 4.8°F warmer than in 2005. Also note that 2005 precipitation was lower than normal, while Oct through Mar precipitation in 2015 was much closer to normal (Fig 2). In 2005, a few intervals of warm, wet weather associated with atmospheric rivers were interspersed with periods of lesser precipitation and near normal temperatures. On the other hand, 2015 featured more consistently above normal temperatures, causing most of the precipitation in the mountains to fall as rain rather than snow. Another significant difference is 2005’s wet spring – including big snows in the mountains in late March – that actually mitigated some feared impacts. In contrast, spring has been drier than normal this year. The May data point isn’t available yet, but will very likely be drier than normal averaged statewide.
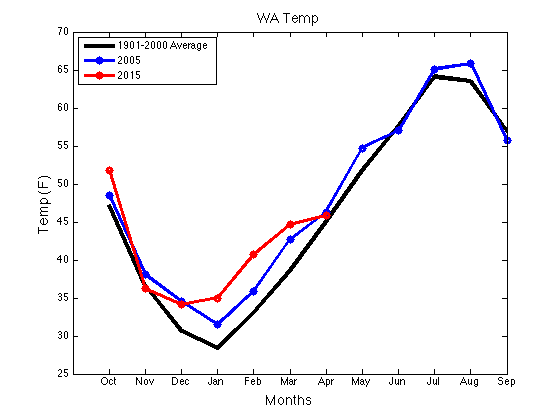 Figure 1: Statewide average temperature for the 2005 and 2015 water years (October through September) compared to the 20th century average (1901-2000).
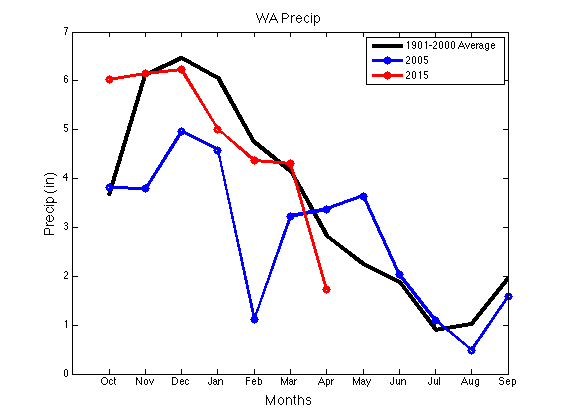 Figure 2: As in Fig. 1, except for total statewide average precipitation.
The combination of low streamflows from snowmelt-dominated rivers and the recent drier than normal conditions impacting streams has resulted in 26% of WA stream gauges with record low flow as of May 31. Table 1 shows the snapshot of the percentage of stream gauges in each category on May 31 compared to the same date in 2005 and 2001. WA State is worse off with respect to streamflow now than in those two previous drought years; 84% of the stream gauges are below normal currently as opposed to 58 and 57% in 2005 and 2001, respectively.
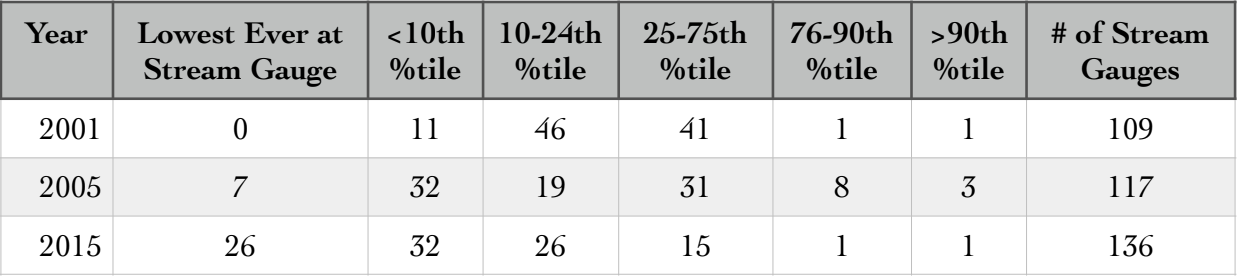 Table 1: Percentage of WA State stream gauges in each percentile (%tile) category on May 31 in 2001, 2005, and 2015.
The consequences of this unique drought year are already being felt, with more expected as summer approaches. There has already been some intervention for fish in the several watersheds, WA State ECY is buying water rights from willing farmers, and recreation industries (skiing and whitewater rafting) have been forced to adapt. More information on the conditions in WA State and actions being taken can be found in OWSC’s weekly drought monitoring report that is released on Thursdays (http://www.climate.washington.edu/events/2015drought/) and on the WA State Department of Ecology drought website (http://www.ecy.wa.gov/drought/index.html).
Reference:
Bumbaco, K.A. and P.W. Mote, 2010: Three Recent Flavors of Drought in the Pacific Northwest, J. Appl. Met. Clim., 49, 2058-2068.