By Nick Bond
OWSC is receiving a large number of inquiries about the hot weather this summer and whether it is due to global climate change. The short answer is no, and the recent weather should be thought of as a short-term climate event. But it has got us thinking about the variability and trends in WA state temperatures during summer, and potential explanations for what has been observed.
We begin by presenting time series of seasonal mean (Jun-Sep) maximum and minimum temperatures for WA state from the U.S. Climate Divisional Database, as provided by NOAA at www.ncdc.noaa.gov/cag/. The seasonal mean maximum temperatures (Fig. 1; red trace) are characterized by greater interannual variability but less of an upward trend, compared with the minimum temperatures (Fig. 1; blue trace). In quantitative terms, linear fits to these time series indicate increases of about 1.3°F in the maximum temperatures and about 2.8°F in the minimum temperatures. Concerns with these time series regarding the quality of the data early in the record, adjustments related to changes in siting and instrumentation, and urban heat island and other effects are addressed at this links provided here (http://www.ncdc.noaa.gov/monitoring-references/maps/us-climate-divisions.php). So why is the increasing trend in summer minimum temperatures more prominent than in the maximum temperatures?
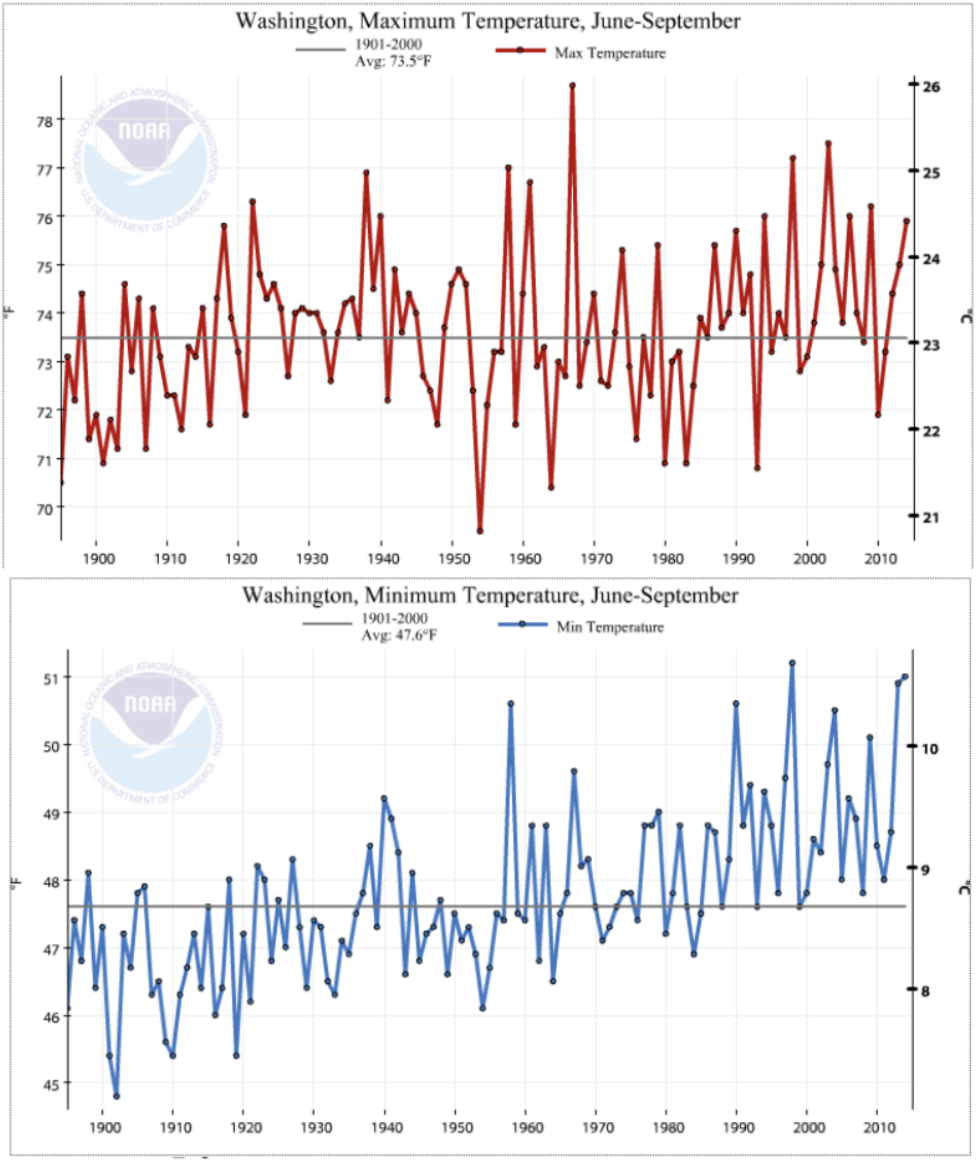 Figure 1: June through September maximum (top) and minimum (bottom) temperatures averaged over WA State from 1895 through 2014 (from NCEI climate division data).
While we cannot explain all of the nuanced differences in the traces, we do have a hypothesis for what has occurred since the middle of the 20th century. There appears to be an increasing trend in the humidity over WA state in summer, and this increase may account for the warmer nighttime temperatures. The humidity record we consider is the average specific humidity of the 1000-850 hPa layer, i.e., the lower 20% of the troposphere, over WA state from the NCEP Reanalysis (blue trace in Fig. 2). This is a synthetic data set, but is closely constrained by the available upper-air observations, in particular the twice-daily rawinsonde soundings from Quillayute (UIL) and Spokane (OTX) in WA state and Salem (SLE) in Oregon, and represents a reasonable estimate of how the low-level humidity has varied since 1950. This time series features mostly a decline from 1950 to the early 1970s, with a single year that was extremely moist in 1958. This happens to be a year during which sea surface temperatures were as high as they have ever been off the coast of the Pacific NW, up until the summer of 2015. The low-level humidity from the early 1970s to the present has risen systematically if not monotonically, with an overall increase on the order of 8-10%.
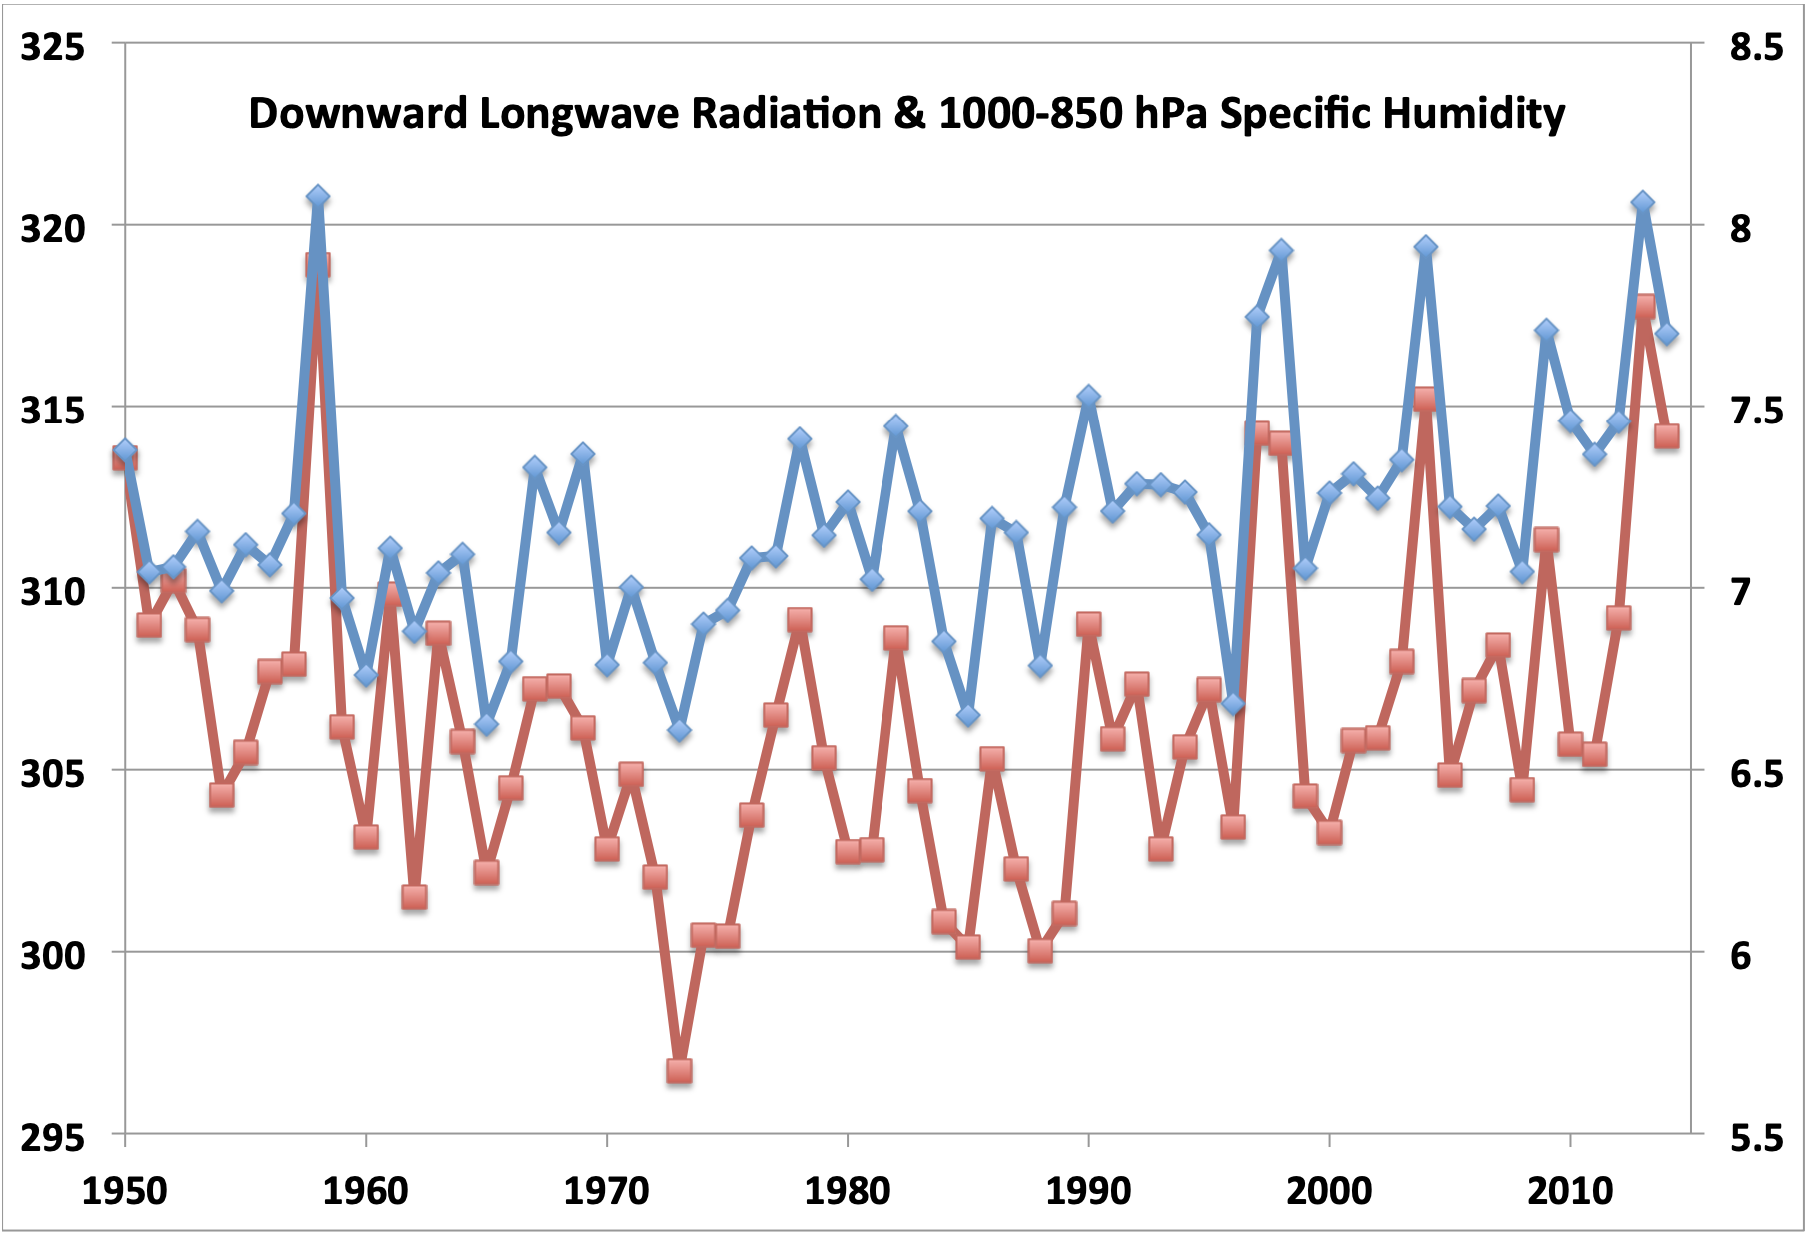 Figure 2: Downward longwave radiation and 1000-850 hPa specific humidity from 1950-2014 from the NCEP/NCAR Reanalysis.
The year-to-year variations in specific humidity are in close correspondence with variations in mean downward longwave radiation at the surface (red trace in Fig. 2), again from the NCEP Reanalysis. The linear correlation coefficient between the two time series is approximately 0.84; the strength of this correspondence is due to the water vapor content being a strong determinant of the emissivity of the atmosphere to longwave radiation. A full treatment of the physics is well beyond the scope of this piece, but in a nutshell, the more moist the atmosphere, the less the optical depth, and the greater the “sky temperature”. Of course, the idea that an increase in humidity means less nighttime cooling is not new. Summer evenings are generally pleasant in WA state because our humidities are low, at least compared with most other regions of the US, especially east of the Rocky Mountains.
The overall upward trend in the low-level specific humidity appears to be more related to an increase in air temperature rather than any systematic changes in relative humidity (not shown). The time series in 1000-850 hPa air temperature (not shown) closely matches that of the mean maximum temperatures at the surface both in terms of the year-to-year variability (the linear correlation coefficient between the two series is almost 0.9) and of the magnitudes of overall trends. On the other hand, the mean minimum temperatures are more strongly correlated with the specific humidity than the air temperature in the 1000 to 850 hPa layer. In summary, based on the analysis carried out here – and we should insert the caveat that this has not been peer reviewed – for the period of 1950 to the present, the minimum temperatures appear to have increased more than the maximum temperatures because they essentially reflect the increases in both lower-tropospheric air temperatures and humidity.