By Nick Bond
We return to the topic of El Niño and what it means for WA. Perhaps this constitutes an obsession, for which we make no excuses. The extremely wet month of December 2015 serves as motivation. In particular, aren’t El Niño winters supposed to be accompanied by relatively warm (and often dry) weather overall, leading to sub-par snowpacks? At least the folks that have had to wait out highway pass closures due to heavy mountain snowfall are probably wondering what gives. The present piece delves into how recent atmospheric conditions compare with those that occurred during past El Niño events and whether these conditions represent a portent for the remainder of this winter.
We begin with consideration of the 200 hPa zonal wind anomalies for the months of October through December, i.e., the first three months of the water year. The map in Figure 1 shows the distribution of these upper-tropospheric zonal wind anomalies for the 10 most recent El Niño events with a substantial expression in the eastern tropical Pacific (listed in Table 1), as defined by a threshold of 1.0°C in the NINO3 sea surface temperature index. This threshold is used to exclude the central Pacific type El Niño events, which tend to have different and generally weaker associations with the seasonal weather of the US (Larkin and Harrison 2005). The climatological mean 200 hPa flow during October through December includes a zonal wind maximum at about 40°N near the dateline bending slightly north and decreasing in magnitude, such that its nose is over Vancouver Island. The October through December period of the 10 previous East Pacific El Niño events (Fig. 1) has been accompanied by a dipole pattern of negative anomalies to the north, and positive anomalies to the south. This implies a southward shift in the upper-tropospheric jet in the Northeast Pacific. That southward shift is more prominent, and includes an eastward extension of the jet towards California, in the mean during January through March of El Niño winters (not shown).
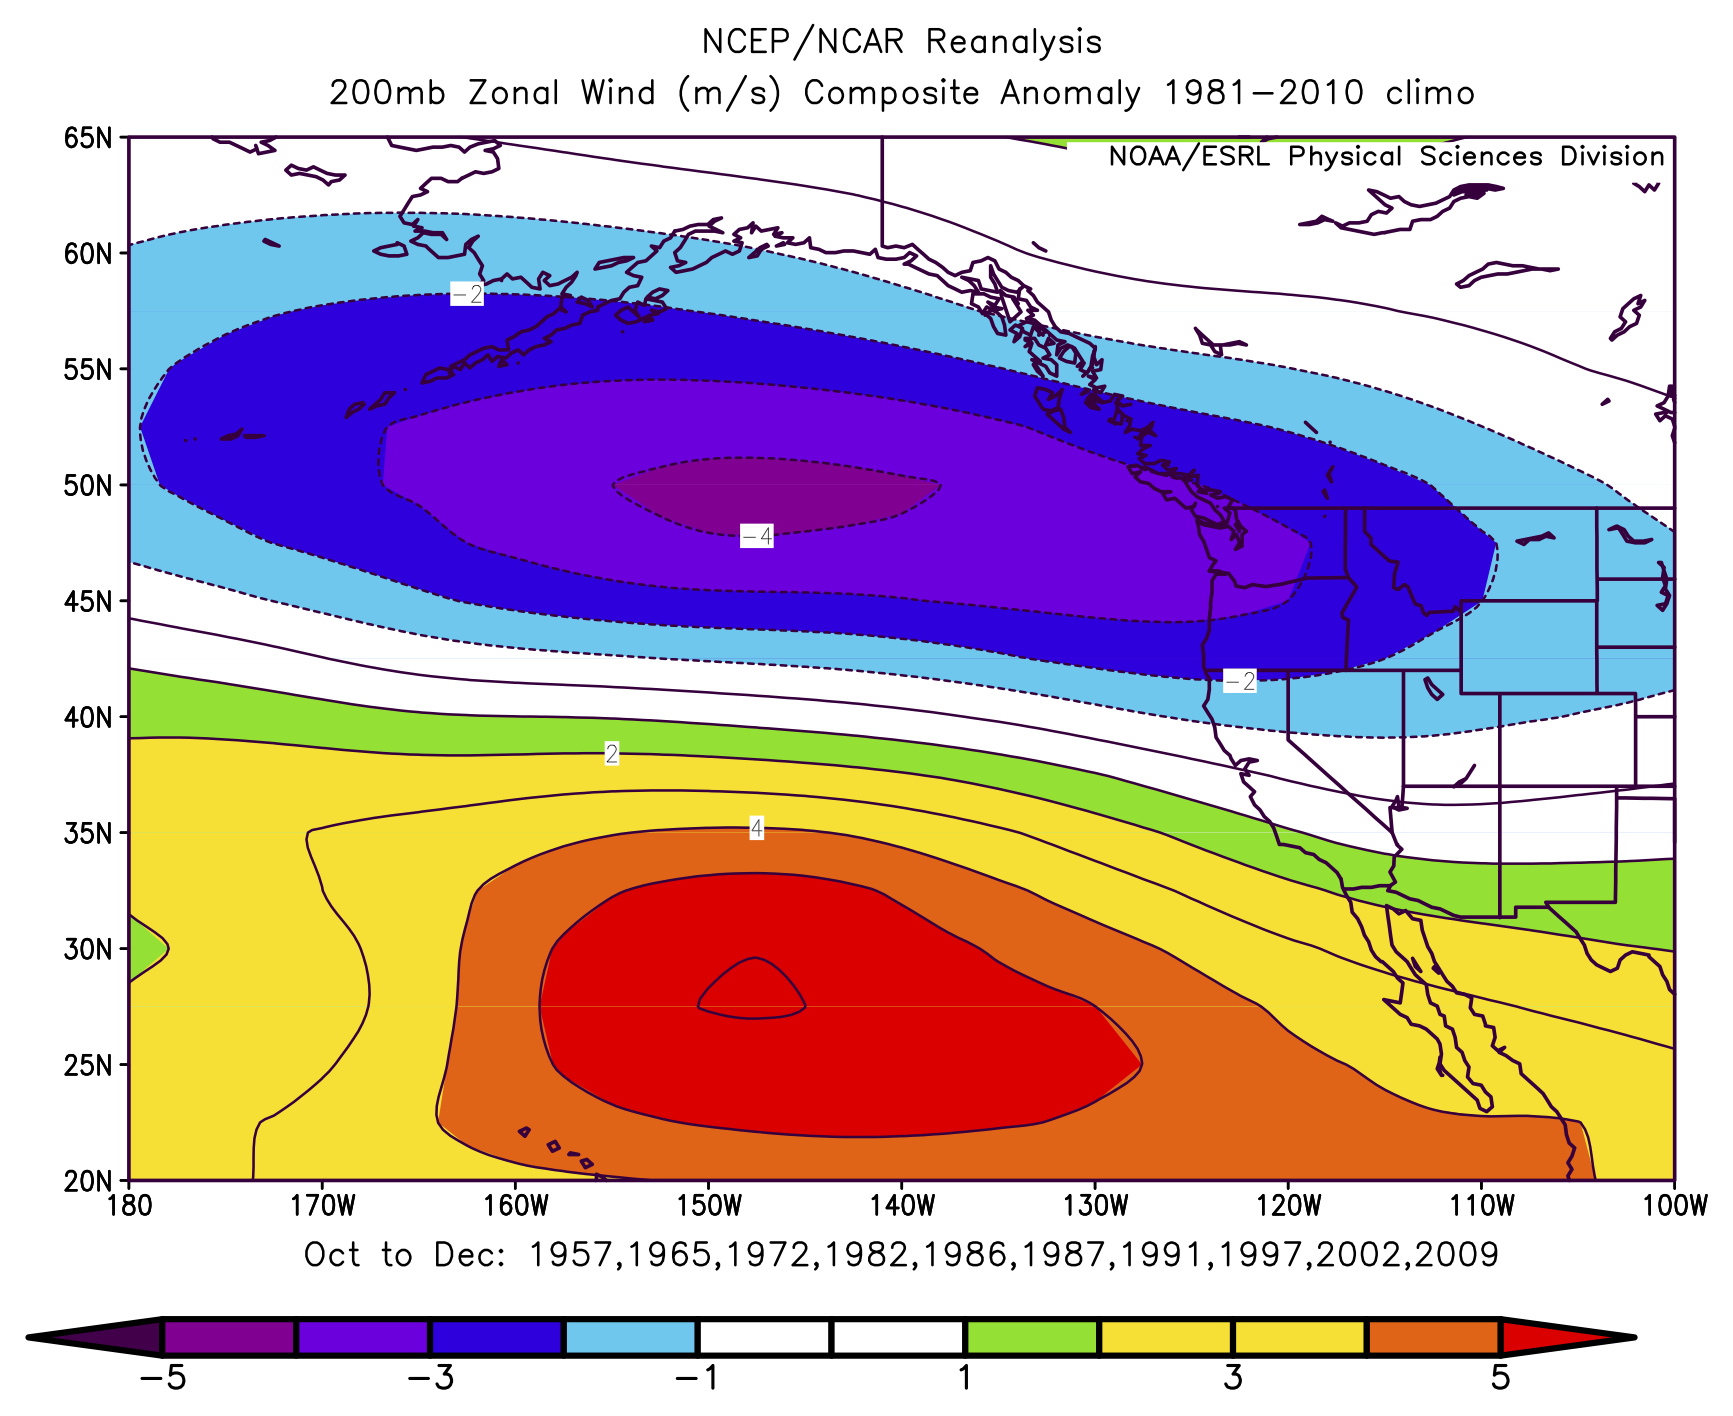 Figure 1: Composite 200 hPa zonal wind anomalies (m/s) during October through December of the eastern Pacific El Niño winters itemized in Table 1.
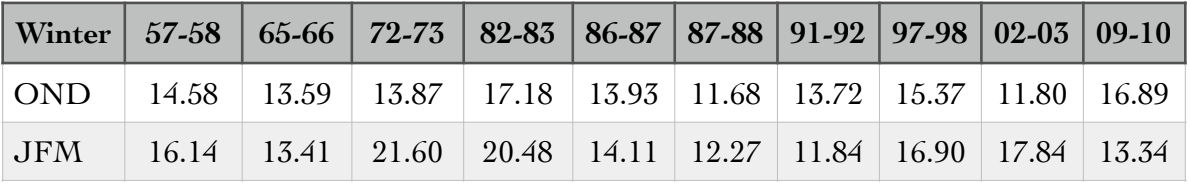 Table 1: Washington State Precipitation (inches) during Past El Niño Winters.
What about October through December of 2015? The 200 hPa zonal wind anomaly map for this period (Fig. 2) bears modest resemblance at best to the previous El Niño composite. The current case included positive anomalies between the Hawaiian Islands and the southwestern US as in the composite, but positive anomalies also extended from the Aleutian Islands across Alaska into northwestern Canada, unlike in the composite. From a WA state perspective the discrepancy was especially large during December 2015, when a band of upper-tropospheric zonal wind anomalies exceeding +10 m/s stretched from south of the Aleutian Islands to the California/Oregon border. This resulted in strong cyclonic vorticity anomalies aloft over WA state, and all of us can appreciate what that meant for precipitation during the month. OK, so the regional weather has been unusually, and unexpectedly, wet. In specific terms, total statewide precipitation during this past October through December was about 22 inches; not a record but rivaling the highest totals since the late 1990s. It does raise the question whether it is liable to have implications for the remainder of this winter.
 Figure 2: Mean 200 hPa zonal wind anomalies (m/s) during October through December 2015.
Towards one way of addressing that issue, we have compared the precipitation during the early (October through December) with the late (January through March) portions of the 10 previous El Niño winters. The results from a statewide perspective are summarized in Table 1. There is a small positive relationship between the two periods amongst this subset of years, but the linear correlation coefficient is only 0.26, which is not that different from zero from a statistical significance perspective. In other words, the total statewide precipitation during October through December is barely related to that during the following January through March during previous El Niño winters. But that does not necessarily mean that all bets are off.
The global climate models comprising the National Multi-Model Ensemble (NMME), as a group, are indicating an upper-tropospheric flow configuration consistent with which has occurred in January through March during previous El Niño events. A map showing the model mean forecast distribution of 200 hPa geopotential height (Z) for January through March 2016, based on initialization during December 2015, is shown in Fig. 3. The anomalously low heights south of Alaska and high heights over the sub-tropical northeast Pacific imply enhanced north-south gradients in Z centered at about 30°N and hence a southward displaced and eastward extended upper-tropospheric jet aimed at California. The positive heights over Canada indicate a tendency for splitting of the flow near the coast of the Pacific NW, which again is a common, if not ubiquitous, feature of the latter part of previous El Niño winters. The projected circulation for western North America favors above normal precipitation for the southwestern US (especially California) and relatively warm and dry weather for the Pacific Northwest.
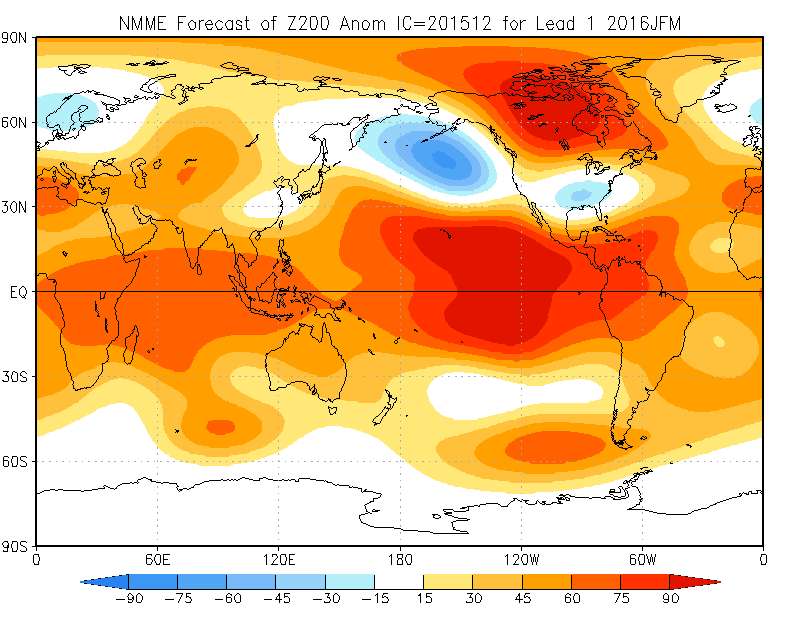 Figure 3: Mean 200 hPa geopotential height for January through March 2016 from the National Multi-Model Ensemble (NMME) based on simulations initialized in December 2015.
An atmospheric circulation pattern for the North Pacific and western North America more typical of El Niño looks to be setting up near the beginning of the calendar year, based on most recent runs of the suite of numerical weather prediction (NWP) models. The all-important details in the pattern, and how long it will last is anybody’s guess. It should be kept in mind that the atmosphere always has some tricks up its sleeve. The upshot is that the skill in seasonal forecasts, even during El Niño, is limited. And now that our socks have finally dried out, we can be grateful that at least we have a good snowpack going into the latter half of winter.
Reference:
Larkin, N.K., and D.E. Harrison (2005) On the definition of El Nino and associated seasonal average U.S. weather anomalies. Geophys. Res. Lett., 32, L13705,doi:10.1029/GL022738.