By Karin Bumbaco
If you’ve been a resident of WA State for only the last two years, you may be under the impression that summer comes early around here. The springs of 2015 and 2016 have been abnormally warm and dry for a majority of the state, lending a hand to this misimpression. In reality, the long-term trends in the spring weather are inconsistent with the past couple of years. This apparent discrepancy is explored here. Spring is defined as the period of March through May here unless otherwise noted.
Figure 1a shows a time series of March-May (MAM) mean temperatures averaged throughout WA State. Springs of 2015 and 2016 averaged 3.1 and 3.8°F above the 1981-2010 normal, respectively. Though we’re only focusing on MAM here, it is worth noting that June 2015 was especially anomalous, with temperatures 7.3°F above normal and a ranking as the warmest June on record; by some measures, June can be considered spring, particularly in western WA. During typical years, many days in June feature plenty of clouds, and complaints about the lack of sunshine.
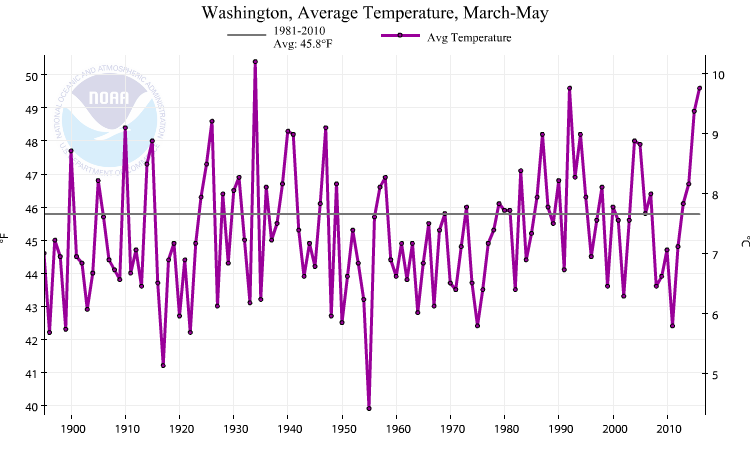 Figure 1a: March through May average temperature averaged over WA state from 1895 through 2016.
Figure 1b shows the time series for MAM precipitation averaged over the state, with 2015 averaging 2.38” below normal and 2016 near-normal with an anomaly of +0.14”. The water supply deficits that developed in spring 2015 were exacerbated by the weather of June, which was extremely dry as well as hot. A local exception to the overall weather conditions of spring 2015 occurred in May in some locations in eastern Washington, where thunderstorms brought above-normal precipitation for the month. Similarly, 2016 MAM conditions in eastern WA were slightly wetter than normal while most of western WA was drier than normal. Nevertheless, the recent springs have been drier than usual for a majority of the state and Pacific Northwest (PNW) as a whole.
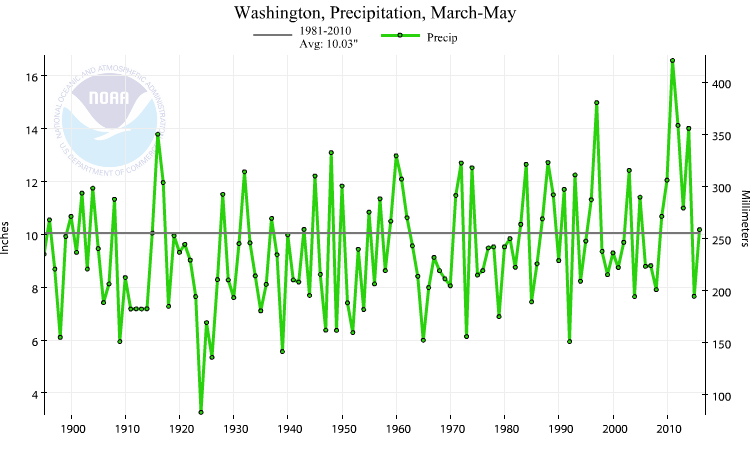 Figure 1b: March through May total precipitation averaged over WA state from 1895 through 2016.
The last two springs are quite anomalous in the context of longer-term trends. In 2014, Abatzoglou et al. published a study that examined Pacific Northwest trends for a variety of time periods. The authors found that there are long-term warming trends across the region in spring, but that they are weak or not statistically significant. Figure 2 shows the spring trends from 1920-2012 for maximum and minimum temperatures across the PNW, with the larger circles representing statistically significant trends. There are some significant warming trends in minimum temperatures across WA, but a few of the stations have significant cooling maximum temperatures trends in WA. Even more interesting is the long-term significant trend for increased precipitation in spring throughout the region. Figure 3 shows widespread significant increases in spring precipitation from 1920-2012 across the region, in contrast to the last two years.
So will our two-year warm and dry spring spell last in the long-term? It’s hard to say, and important to note that including the 2015 and 2016 spring temperatures and precipitation in the long-term trend analysis is unlikely to impact the direction or significance of the trend. A continued run of more warm and dry springs are needed to shift the observed trend, and there will undoubtedly be cool and wet springs in future years as a part of natural climate variability in the region. Future climate model projections for the PNW show warmer average spring temperatures, but more uncertainty in spring precipitation projections, with some individual models indicating precipitation increases and others decreases through the mid-21st century. More information on future climate projections in WA State can be found here: https://cig.uw.edu/resources/special-reports/northwest-climate-assessment-report/. And those interested in exploring climate model simulations of the future climate are encouraged to check out the slick application developed by NOAA’s Earth Systems Research Laboratory available at the following website: http://www.esrl.noaa.gov/psd/ipcc/cmip5/.
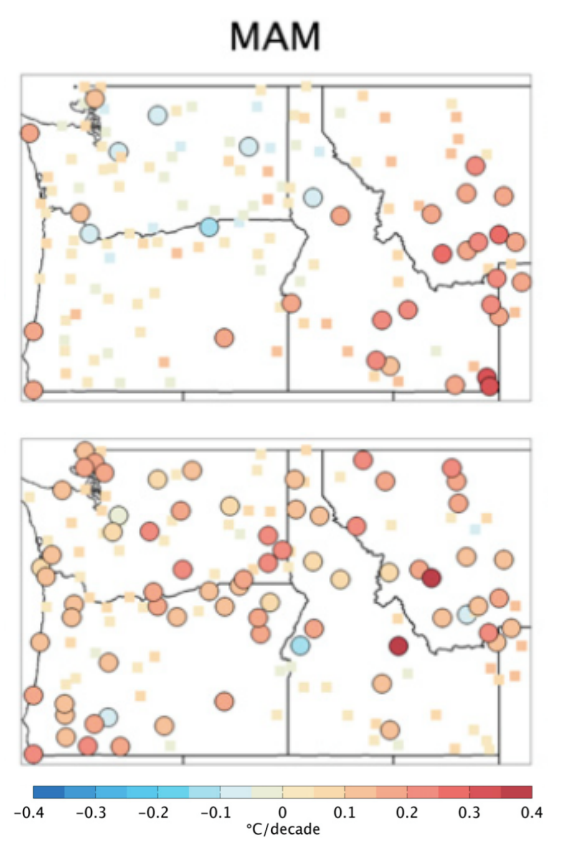 Figure 2: Trends in March through May maximum temperatures (top) and minimum temperatures (bottom) from 1920 through 2012. Circles represent statistically significant trends; squares are not significant.
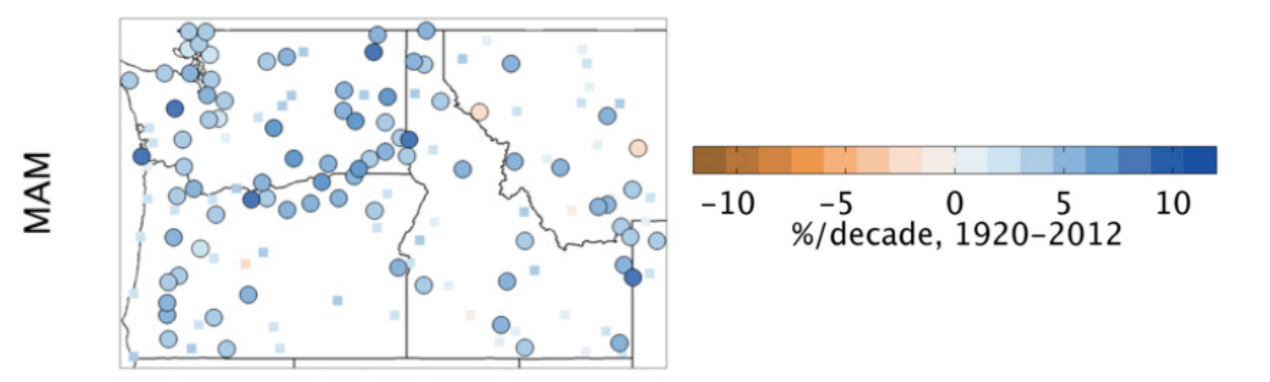 Figure 3: Trend in March through May total precipitation from 1920 through 2012. Circles represent statistically significant trends; squares are not significant.
Reference:
Abatzoglou, J.T., D.E. Rupp, and P.W. Mote, 2014: Seasonal climate variability and change in the Pacific Northwest of the United States, J. Clim., 27, 2125-2142.