By Nick Bond
With exceptions such as a warm spell near the end of July, WA state has experienced relatively cool and cloudy weather since the first week of June 2016, at least as compared with the same period during the last 3 summers. With the long days and high sun angle during our summers, it stands to reason that cloudier intervals will tend to include lower maximum temperatures. But how much blame, or gratitude, should be given to the clouds? Recognizing our treatment is more suggestive than definitive, and that cause and effect cannot always be separated, here we will consider a related set of questions.
- How well do cloud anomalies on the west side of the Cascade crest correspond with those on the east side?
- What determines statewide mean maximum temperature in WA during summer months?
- What determines statewide average cloudiness during the summer?
- How consistent are the relationships involving maximum temperature and cloud cover for the three different months of June, July and August?
- How well can maximum temperature be predicted from large-scale atmospheric parameters?
Three data sets are used here in addressing the questions above. For statewide maximum surface temperatures, we use values based on weather station data as compiled and averaged by NOAA’s NCEI and available at the “Climate at a Glance” website. With regards to cloudiness, we take advantage of the cloud fraction data from PATMOS-x on a 0.5 x 0.5 degree grid. This product is based on brightness temperatures from the Advanced Very High Resolution Radiometer (AVHRR) sensor that has been flown on polar-orbiting satellites. The PATMOS-x product features complete areal coverage as opposed to station data, which can be prone to highly localized effects. While the PATMOS-x data cannot be used to specify cloud types, it does represent a reasonable means for assessing monthly values in mean cloud cover. Finally, towards specification of regional atmospheric circulation parameters related to maximum temperatures (Tmax) and cloud fraction anomalies, we use our good friend the NCEP Reanalysis. The PATMOS-x data set is available for the period of 1983 through 2009; we focus on the months of June, July and August for those years.
We begin with question (1) because the answer pertains to how the remaining questions should be considered. Towards that end, for the latitude band of 46 to 49°N, we correlated the interannual variations in mean cloud anomalies in the longitude band of 124 to 121°W (western WA) with that of 121 to 117°W (eastern WA) for the years of 1983 through 2009. The linear correlation coefficients for the months of June, July, and August are 0.90, 0.92, and 0.81, respectively. As another means of illustration, time series of July cloud fraction anomalies in percent for the western and eastern portions of WA are also shown in Figure 1. Western WA is cloudier than eastern WA during the summer on average, of course, but these results indicate a surprisingly tight correspondence in terms of monthly mean anomalies. Therefore, for the remainder of this treatment we will deal with statewide averages.
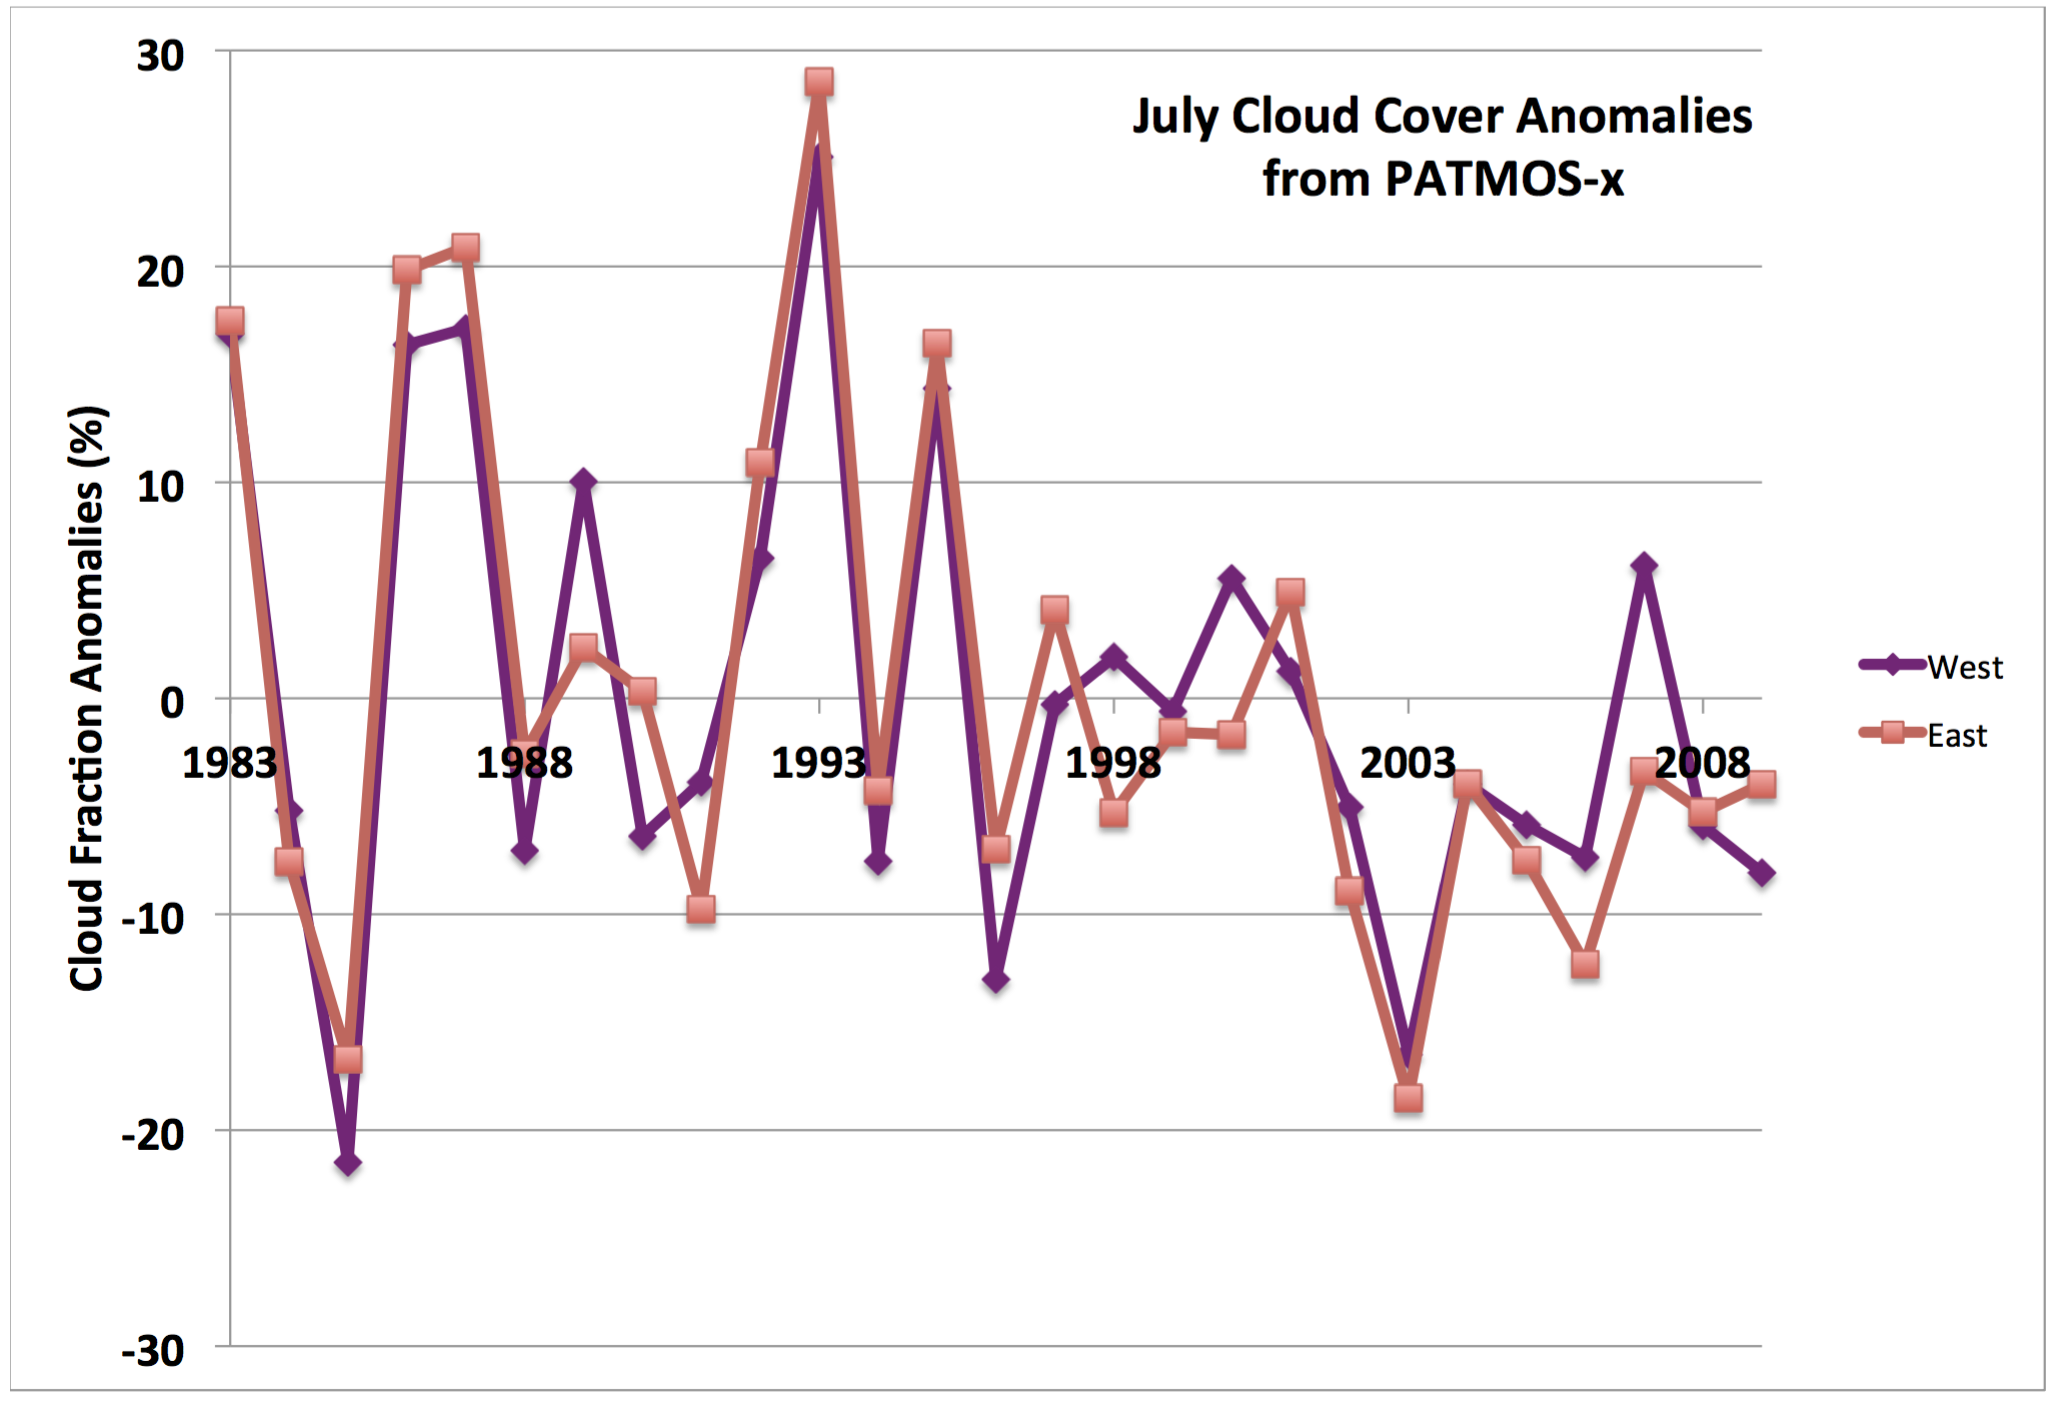 Figure 1: Time series of monthly mean cloud anomalies for western (purple) and eastern (red) WA from 1983 through 2009.
For the rest of the questions we have examined the relationships between Tmax, statewide cloud fraction anomalies, and regional atmospheric variables using a generalized additive model (GAM). The GAM framework offers a simple way to quantify the co-variability between the quantities of interest. It is akin to multiple linear regression, but can account for the potential of non-linear relationships between predictors and the target variable or predictand. These functional relationships are not prescribed but instead deduced by the GAM from the data. The functions themselves range in complexity from linear to smooth cubic splines; the GAM is designed to seek as simple a set of relationships as possible that adequately fit the data.The R statistical software package (http://www.r-project.org) was used in the construction of the GAMs.
Individual GAMs were constructed for statewide Tmax and cloud fraction anomalies for June, July and August. A variety of regional variables were used as predictors. From the NCEP Reanalysis we considered statewide monthly mean values of the following atmospheric variables: 500 hPa geopotential height (500Z), 1000-500 hPa thickness, 925 hPa zonal wind, 925 hPa meridional wind, 925 hPa specific humidity, total precipitable water, 700 hPa omega (vertical velocity), and surface to 850 hPa temperature lapse rate. We also considered SST for the region off the coast of the Pacific Northwest (45-50°N, 132.5-125°W). All of the GAMs were constructed using data for 1983-2009 and in the interest of simplicity, and to avoid overfitting, were restricted to either two or three predictors. Obviously, there are a large number of different combinations that could be tested, and our approach has been only exploratory. Nevertheless, some recurring results were found.
First and foremost, it is apparent that either the 500Z or 1000-500 hPa thickness was the best predictor of both Tmax and cloud fraction in each of the summer months. In quantitative terms, GAMs using 500Z or thickness and an additional variable or two explained about 90% of the interannual variance in monthly mean Tmax, and on the order of 60 to 70% of the variance in mean cloud fraction. Most of the signal (~80-90%) in these models with multiple predictors could be attributed to either the 500Z or thickness. Models with 500Z or thickness as predictors (they are essentially interchangeable) but without cloud fraction were more skillful than those with the cloud fraction but lacking 500Z or thickness when predicting Tmax. With regards to the other variables tested, the 925 hPa flow was typically one of the better secondary variables, with the zonal component a superior predictor of Tmax and the meridional component a superior predictor of cloud fraction. Regarding cloud fraction, in some cases the 925 hPa specific humidity was a better predictor than the total precipitable water, and in other cases it was the reverse. In general, the 700 hPa vertical velocity and surface to 850 lapse rate were relatively poor predictors of either Tmax or cloud fraction. We were especially struck how a rather simple GAM using 500 hPa Z and SST reproduced about 90% of the observed variance in Tmax in each of the summer months.
Okay so it is all well and good that GAMs can recreate time series of Tmax and cloud fraction over the period of construction but are the deduced relationships actually robust? In the present application, the functional relationships from GAMs based on the data from 1983 through 2009, and subsequent data from 2010 through 2015, have been used to determine the skill of such a model in predictive mode. Here we show the results of such a test using 500Z and SST as predictors, with the observed versus modeled Tmax in June, July and August for the years of 2010 through 2015 plotted in Figure 2. The mean absolute error was 0.7°F, which is about one-quarter of the standard deviation in the observed monthly mean Tmax. In other words, simple models based on regional parameters can be quite respectable in terms of their skill in reproducing summertime monthly mean maximum temperatures in WA.
The results described here can be interpreted in a variety of ways. Getting back to the ruminations that inspired the analysis in the first place, it appears that the large-scale tropospheric circulation largely controls both surface maximum temperatures and cloudiness, and so neither causal effect in the title of this piece seems strictly proper. Our results do have some implications for extended (seasonal and longer term) weather prediction in WA, and that is the importance of accurate specification of the large-scale flow.
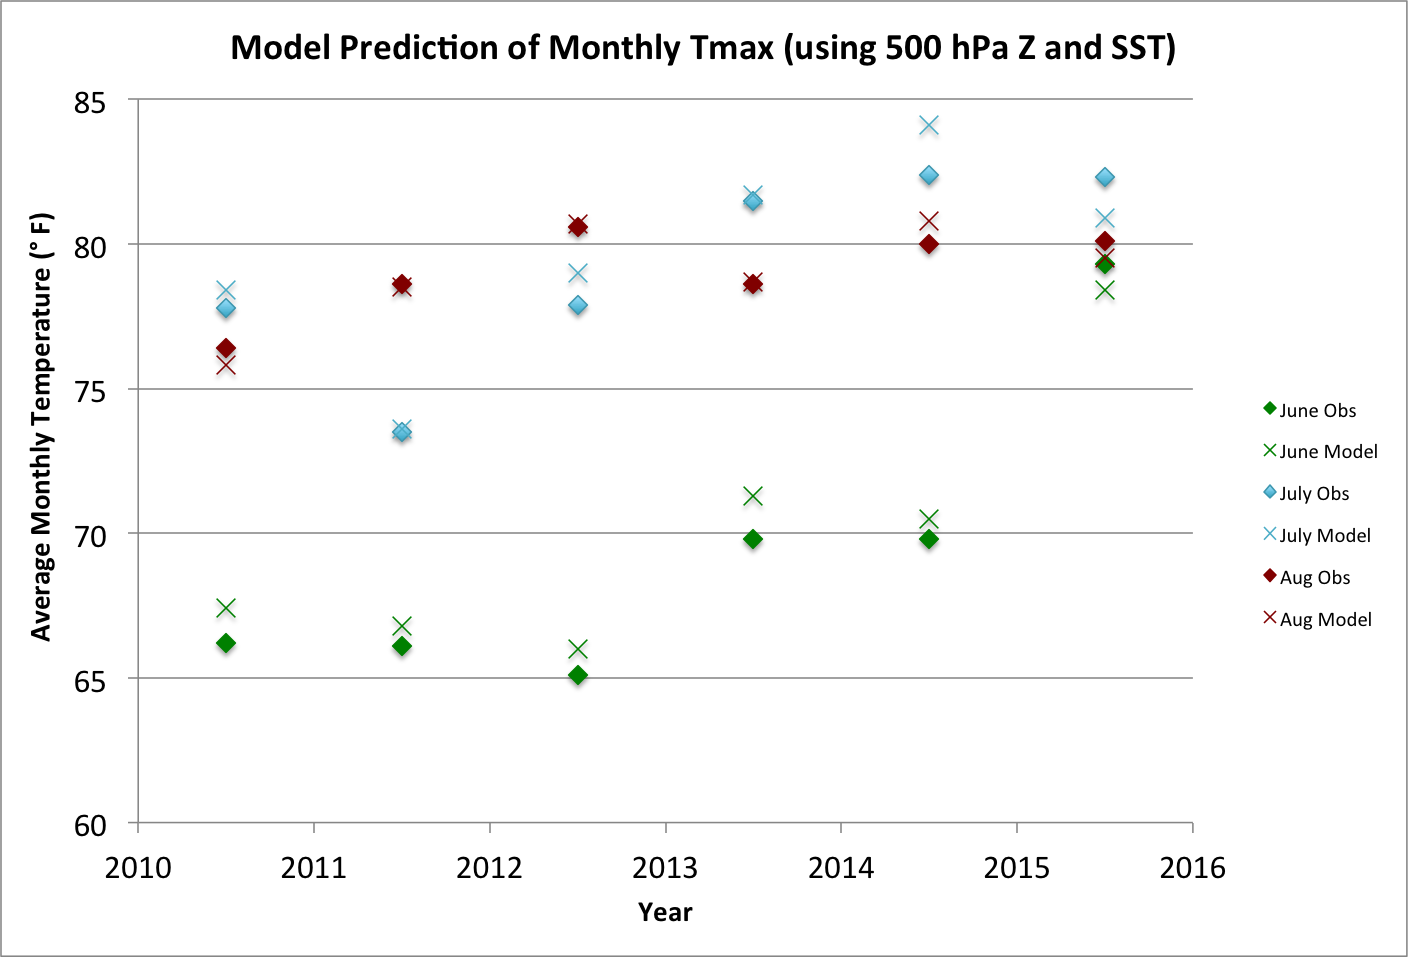 Figure 2: Example of predicted vs. observed Tmax for June (green), July (blue), and August (red) for 2010-2015. This is using a model with only 500 hPa geopotential heights and sea surface temperatures (SSTs) as predictors of Tmax.