By Nick Bond
Most readers of this newsletter are probably aware of the warming of winter temperatures in Washington state. In specific terms, from near the end of World War II to the present, average winter (November through February) temperatures have increased by about 2 degrees F. Much of that overall warming is due to the late 1940s and early 1950s being especially cold, in the context of the entire observational record going back to the 1890s. Moreover, we have not had a really cold winter since the early 1990s. The sense of the long-term change in winter precipitation is not as obvious, and for good reason, since there is a great deal of year-to-year variability on top of overall trends that are weak to negligible. How about lowland snow? Of course, there are plenty of societal impacts with this aspect of our winter weather, and we thought a survey of the historical data would be of interest.
As with many if not most elements of the climate, the story is not so simple. Notably, the variability in the climate on decadal time scales complicates matters. In addition, trends in snowfall might be expected to vary across the state, at least in part due to the lower frequency of cold air at low levels on the west side of the Cascades. While we have made an attempt to account for these factors, we also admit our analysis is more “quick and dirty” rather than comprehensive. For example, we have simply omitted years with too many missing days of data in calculating averages. Nevertheless, we feel that the results are reasonable and valid in a broad sense. An additional point worth making is that the cold air and moisture required for a major snowfall do not coincide very often, especially on the milder west side. Rare extreme events adversely affect the statistical reliability of the results. Therefore here we also consider how the average number of cold days per winter has changed over time at various locations. For this purpose, we define a cold day as one for which the maximum temperature is 32 F or less for eastern WA locations, and 36 F or less for western WA locations. We use a less restrictive standard for the western WA to include more days; the threshold used represents unusually cold conditions during which precipitation could be in the form of snow.
Time series of winter totals of snowfall and number of cold days are shown for Sea-Tac Airport in Figure 1. There has been a clear decline at Sea-Tac in winter snowfall and number of cold days. Winters lacking snow and cold days occurred occasionally in the first portion of the period but not as often as in recent years. The two big year snow years of 1949-50 and 1968-69 really stand out, with the 20+ inches of 2008-09 being a notable exception among the wimpy winters of the last couple of decades. We still get at least a few cold days most winters but these days are not always accompanied by much, if any, snow. Some of these periods feature high pressure and calm winds resulting in the development of surface-based inversions and persistent, shallow layers of cold air. Those situations are not nearly as fun for kids aged 4 to 84.
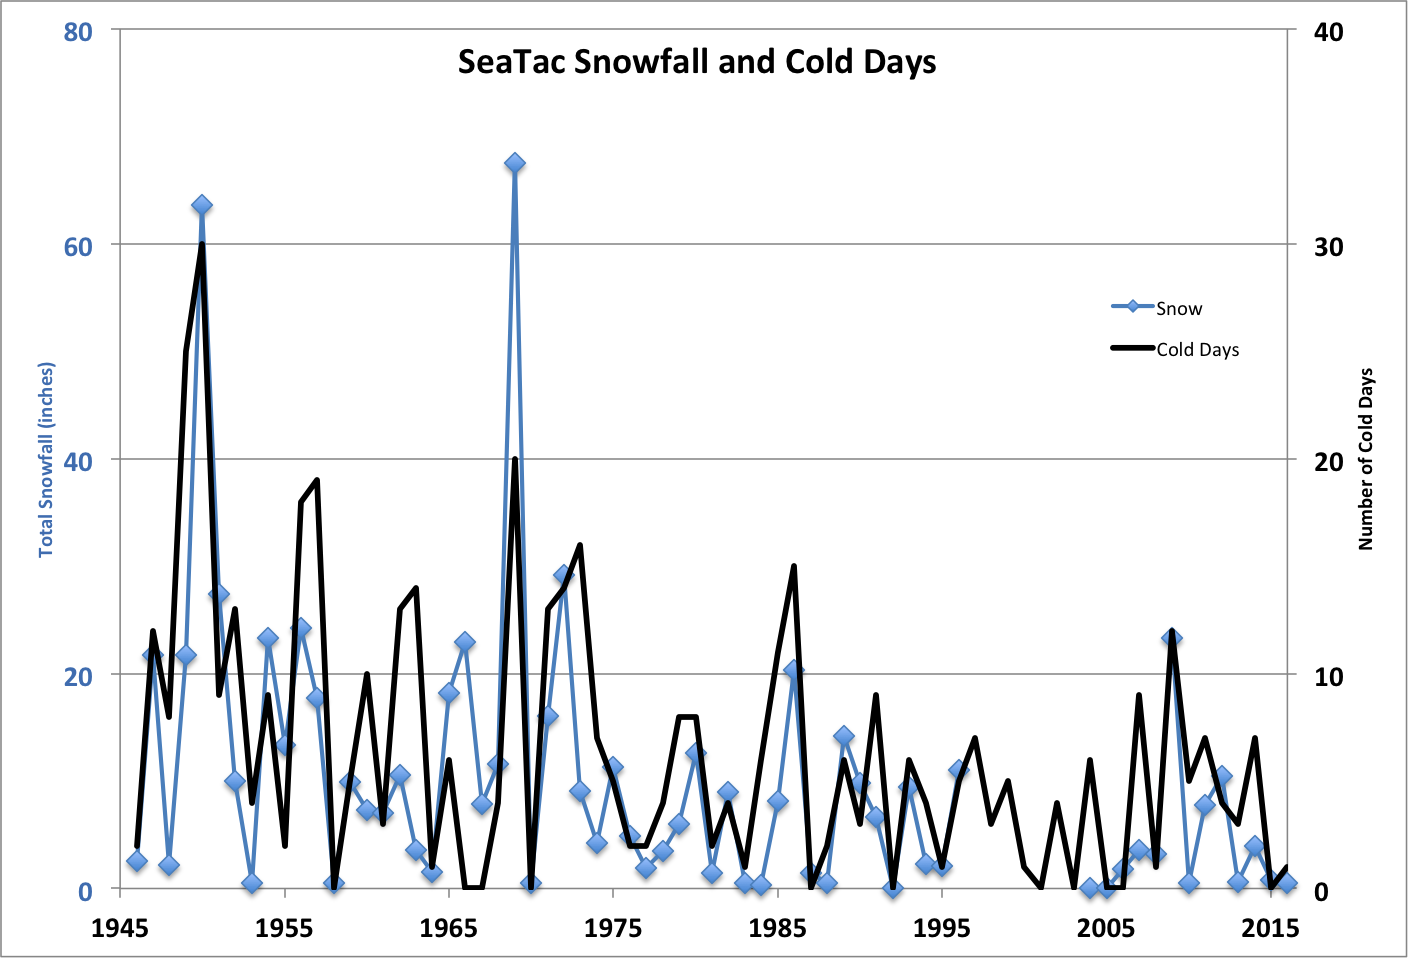 Figure 1: Annual November-February total snowfall (blue) and total number of days 36°F or below (black) for SeaTac Airport.
Equivalent time series are plotted for Yakima Airport and Spokane in Figures 2 and 3, respectively. These time series have quite different characteristics than their counterparts for Sea-Tac. Simply put, there does not seem to be much in the way of long-term trends in winter snowfall totals or number of cold (freeze) days. The last 15 years or so at Yakima have lacked any especially high snowfall totals or number of cold days, but given the noisy time series the linear trends are not statistically significant. Spokane has featured remarkable consistency in the severity of its winters in terms of the measures used here, with lots of interannual variability. The snowiest winter at Spokane (97.7”) in a record extending back to the 1890s occurred relatively recently in 2008-09.
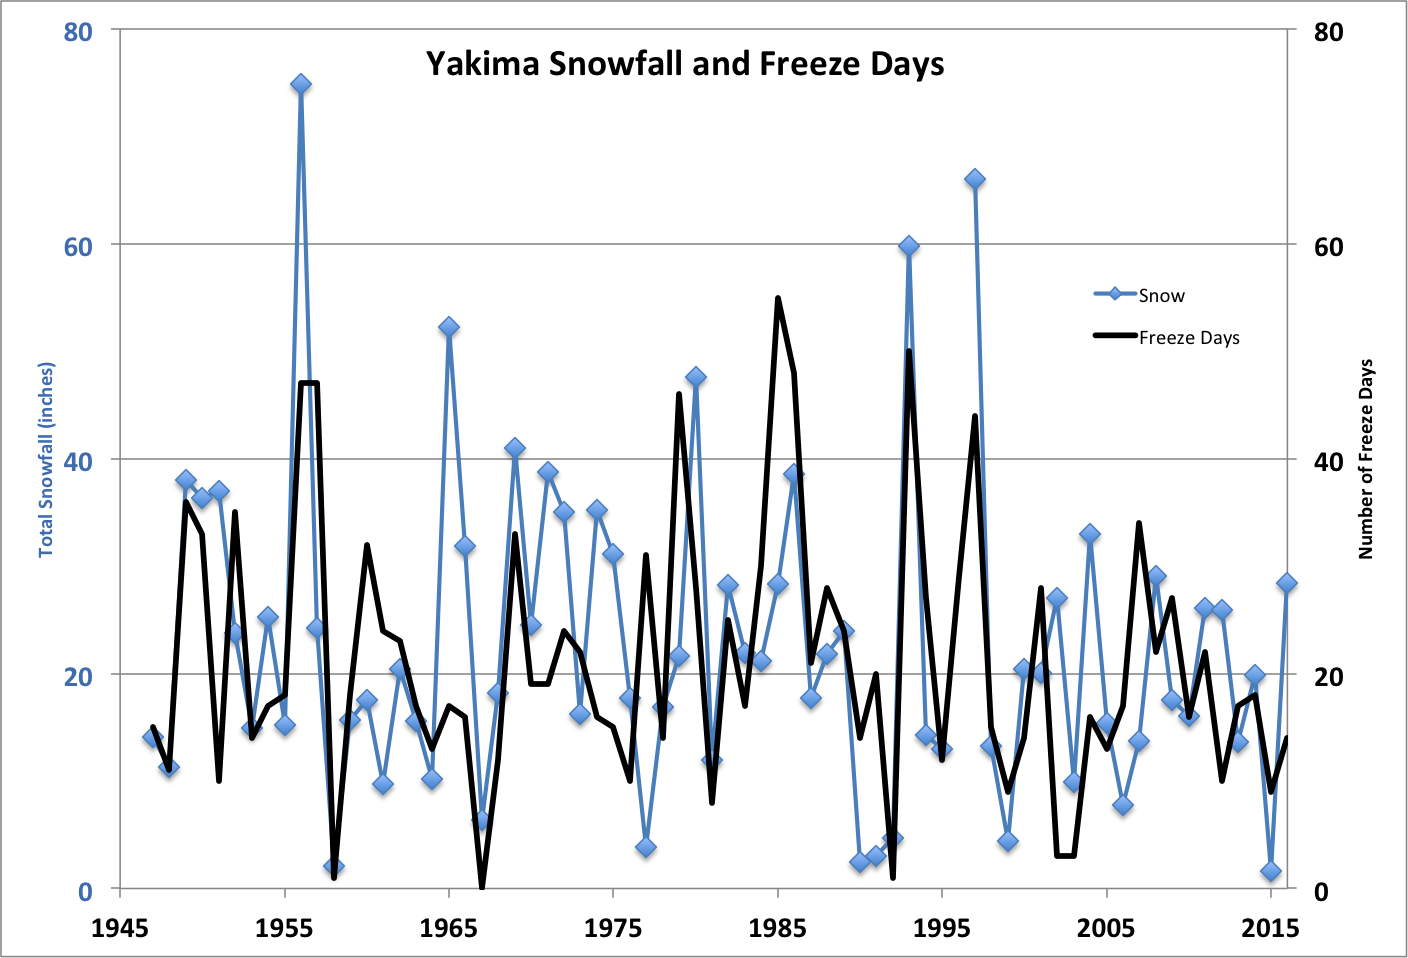 Figure 2: As in Figure 1, except cold days are defined as 32°F or below.
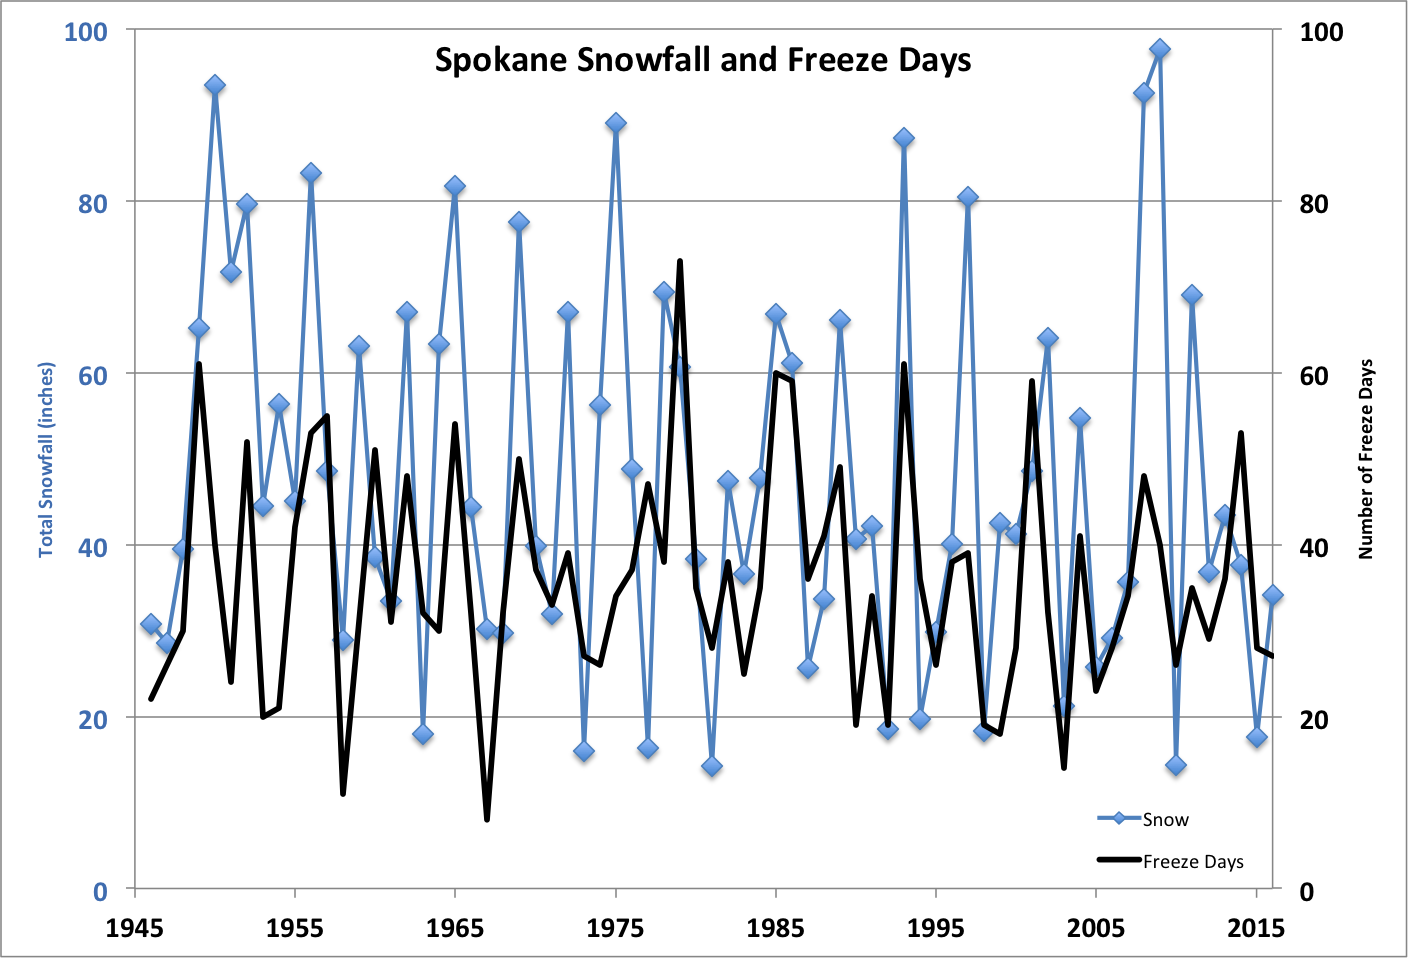 Figure 3: As in Figure 2 but for Spokane.
So is Sea-Tac more typical or an aberration for the west side of the state? For this reason we examined a couple more stations, Hoquiam on the coast and Sedro Wooley near the mouth of the Skagit River, with decent records. For these two locations, and the additional east side location of Pomeroy near the southeastern corner of WA, we computed average total winter snowfalls and numbers of cold days for three different periods: 1948-1970, 1971-1993 and 1994-2016. We picked these periods to be long enough to yield reasonable averages and with breaks that do not coincide with the major shift in the regional climate that occurred in the late 1970s. For those three stations, and the three stations with plotted time series discussed above, mean values of winter total snowfall and number of cold days are itemized in Tables 1 and 2, respectively. The other west side locations of Hoquiam and Sedro Wooley also have had less snow and fewer cold days in the more recent third of the interval considered here. The results for Pomeroy resemble those for Yakima and Spokane.
 Table 1: Average snowfall (inches) for November-February for 3 different historical periods.
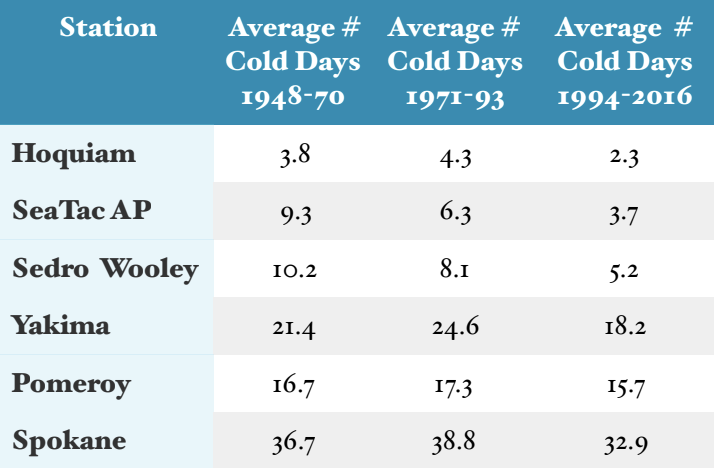 Table 2: Average number of cold days during November-February for 3 different historical periods.
The bottom line for snow enthusiasts: historical trends appear to be much more favorable for eastern Washington state. That being said, the climate has plenty of tricks up its sleeve. An odd and unexpected deal of the cards, such as the Puget Sound region getting buried, is still possible. Take a wild guess whether the OWSC wants something like that to happen.