By Karin Bumbaco
The past summer has been quite remarkable in the Pacific Northwest. Averaged over WA State, the June through August average temperatures ranked as the 4th warmest in the historical record with temperatures 2.6°F above the 1981-2010 normal. Total June through August precipitation also ranked in the top 10, coming in as the 7th driest for WA State with over a 2” rainfall deficit compared to normal. But aside from the temperature and precipitation stats, this past summer was also distinct for the amount of wildfire smoke that lingered over the state. The summer air quality is explored here.
While smoke is present at least somewhere in the state in a typical summer, the smoke and associated poor air quality for this past summer was certainly the worst its been in recent memory for western WA. There were more smoky, hazy days than usual, with ash from fires settling outside on vehicles and on open windowsills on several occasions. The concentration of PM2.5, or particulates less than 2.5 micrometers in size, is one measure of air quality and is explored here. These small particles are hazardous to human health, and their small size allows them to get deep into a person’s lungs where they can cause a variety of health problems.
An example of PM2.5 concentrations for a monitoring station in Kent is shown in Figure 1. Hourly PM2.5 values are shown from July 1 through September 24 for both 2017 and 2015. 2015 is used as a comparison because it is the worst fire season in WA since the National Interagency Fire Center (https://www.nifc.gov/fireInfo/fireInfo_statistics.html) started keeping comparable records in 2002. The final fire acreage numbers for WA fires in 2017 are not yet available at the time of this writing, but we do not expect 2017 to be a record year. There were serious fires, but many of the poor air quality days in western WA were actually due to fires in British Columbia or Oregon. Figure 1 also shows the air quality index (AQI) on the y-axis that corresponds to the PM2.5 concentration, ranging from “good” (green), to “moderate” (yellow), to “unhealthy for sensitive groups” (orange), to “unhealthy” (red) levels.
The difference between 2015 and 2017 is marked. There were 3 separate incidences of PM2.5 values reaching levels that were either unhealthy for sensitive groups or unhealthy for all groups during the 3- month period in 2015, and those events lasted 2 days at most. On the other hand, 2017 had 5 separate incidences of unhealthy air as defined by PM2.5, and one of those events lasted for 11 days (August 1-11 with 1 day of lower pollution on the 5th). So, those of us in western WA weren’t imagining it – the smoke and air quality really was worse than usual this past summer.
Despite the poor air quality this summer, annual average PM2.5 levels have been improving in the long-term. The declines are due to winter declines in PM2.5 as there is little systematic change in summer trends. Figure 2 doesn’t include 2017, but Northwest annual PM2.5 has decreased since 2000 by 40%. This is largely due to national and local monitoring and regulations such as those in place by the EPA. More information on winter PM2.5 levels was presented in our November 2016 newsletter, and includes a longer local record winter PM2.5 time series.
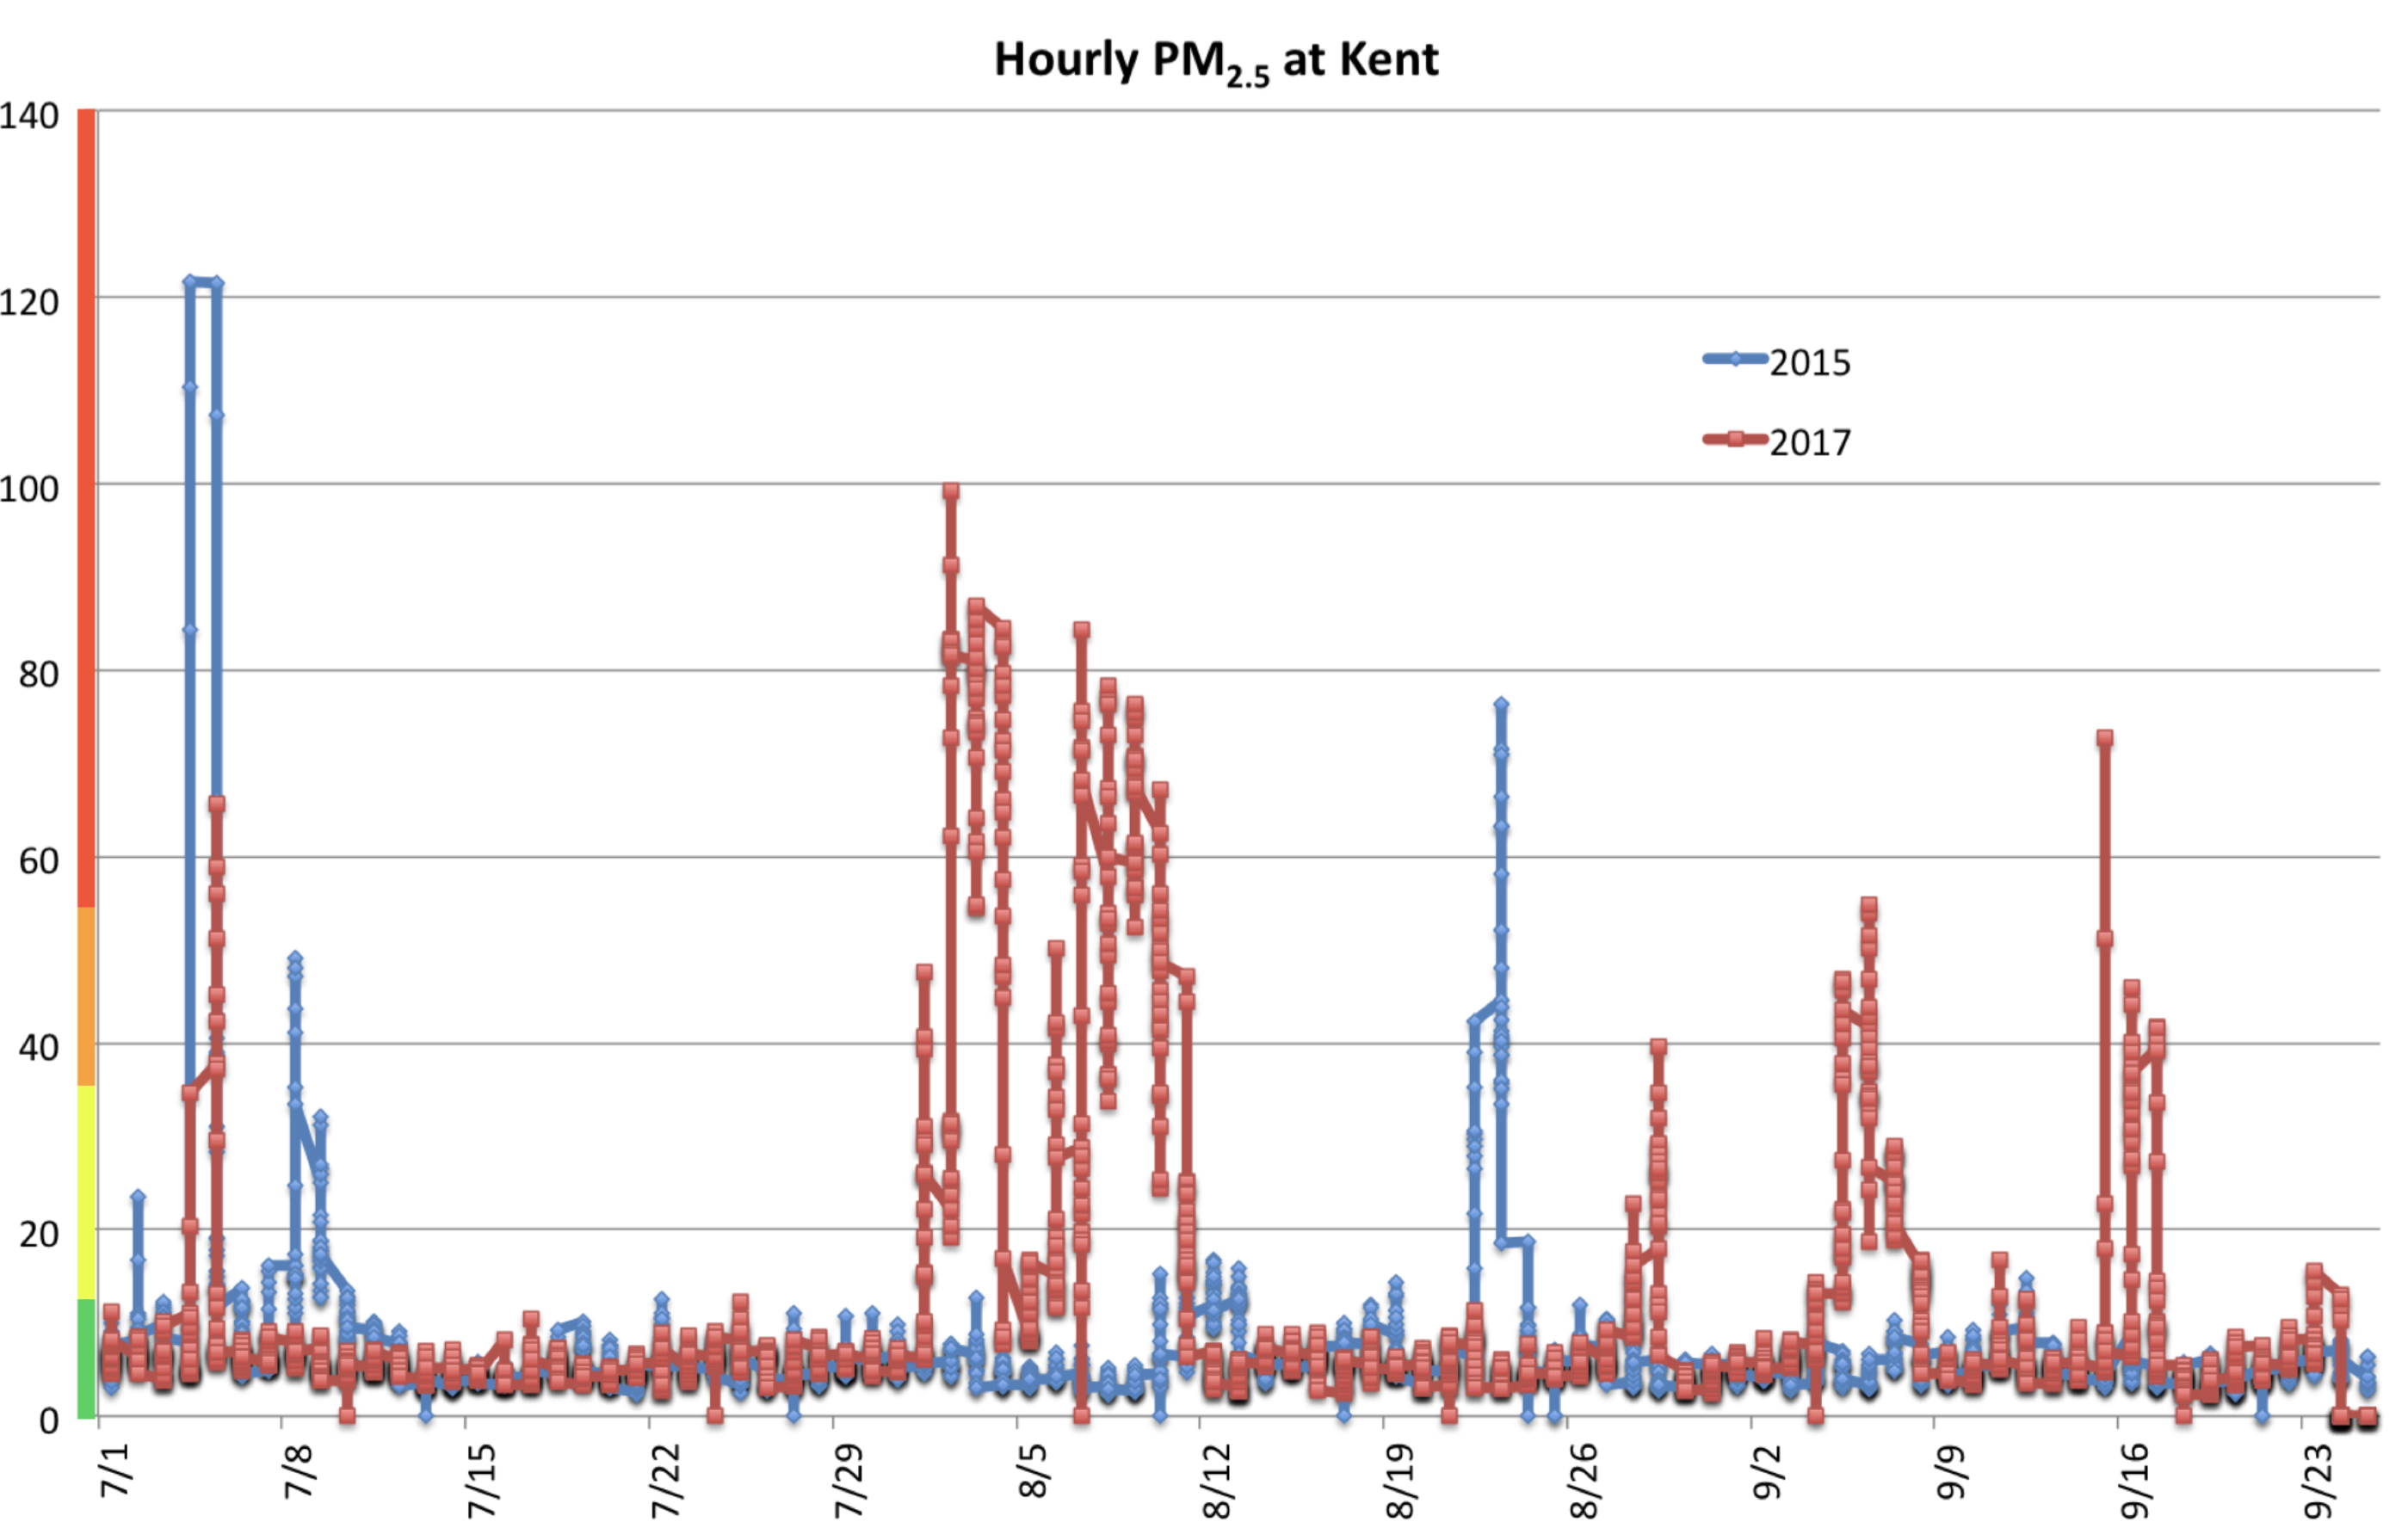 Figure 1: Hourly PM2.5 concentrations (in micrograms/m3) at Kent for 2015 (blue) and 2017 (red) from July 1 through September 24 from the Puget Sounds Clean Air Agency. The colors on the y-axis show the Air Quality Index that corresponds to the PM2.5 concentration. Green is “good”, yellow is “moderate”, orange is “unhealthy for sensitive groups”, and red is “unhealthy”.
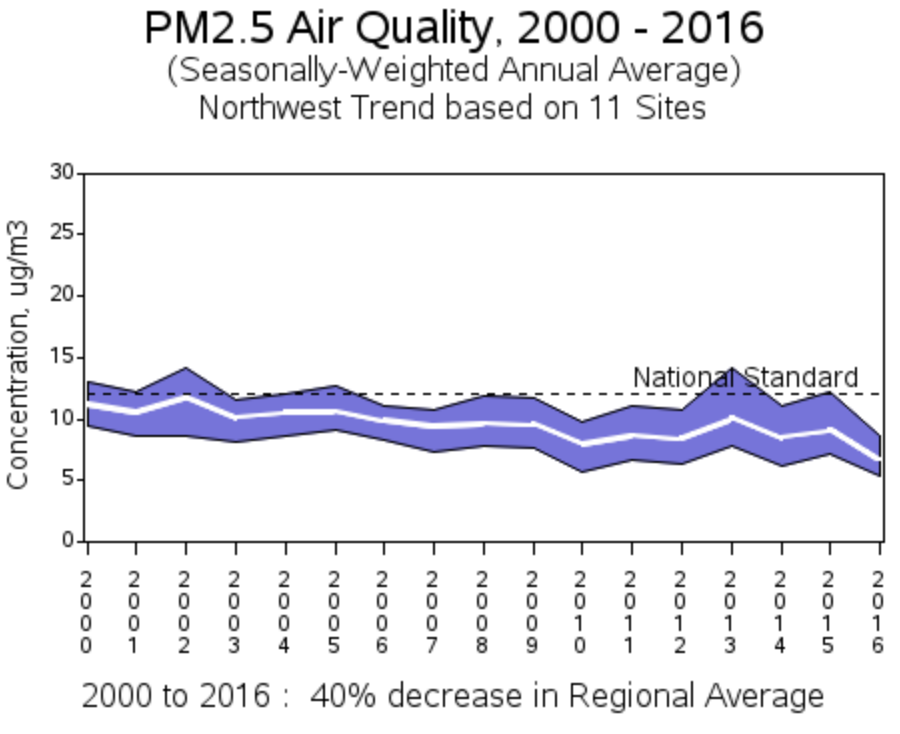 Figure 2: Annual average PM2.5 concentrations (micrograms/m3) for the Northwest (WA, OR, and ID)from 2000 through 2016 from the EPA.