By Nick Bond
There are all kinds of options for gathering and plotting historical weather data online. Regular consumers of this kind of data are liable to have their favorite sources and in this regard, familiarity comforts (rather than breeds contempt, as the saying goes). Nevertheless, we thought that readers of this newsletter might appreciate learning about a couple of slick web sites, one that has been around for a while and one that is relatively new, for not just extracting US surface weather data, but also examining these records in convenient and interesting ways.
We begin with the web resource maintained by the Midwestern Regional Climate Center (MRCC), specifically the MRCC Application Tools Environment (Cli-MATE). This data portal (https://mrcc.purdue.edu/CLIMATE/) represents an easy way to download and graph weather and climate data from US stations; users must register but access is free. Both daily and hourly data are available; the latter type of historical data tend to be more difficult to find but this website makes it easy. Hourly data is only available here from the airport stations(SeaTac Airport, Spokane Airport, etc.). There are additional networks such as Agrimet, AgWeatherNet and RAWS with high-temporal resolution weather data available, of course, but those data are not available on either on the sites featured here. Returning to the Cli-MATE web site, one of its strong points is the intuitive interface for selecting station(s). One can specify the state and county or climate division of interest, see what stations are available, and then grab or graph time series of the variables of interest. The website also has some built-in capabilities to place daily data in historical contexts, as shown in this screenshot (Figure 1) from a
help page (https://mrcc.purdue.edu/CLIMATE/productGuide.pdf). We find the threshold and multi-day options to be especially useful for characterizing extended periods of unusual weather. This brief discussion of Cli-MATE does not do justice to all of its goodies. Readers of this newsletter are encouraged to explore for themselves. But be forewarned, one may spend more time doing so than anticipated since such explorations are liable to be so interesting.
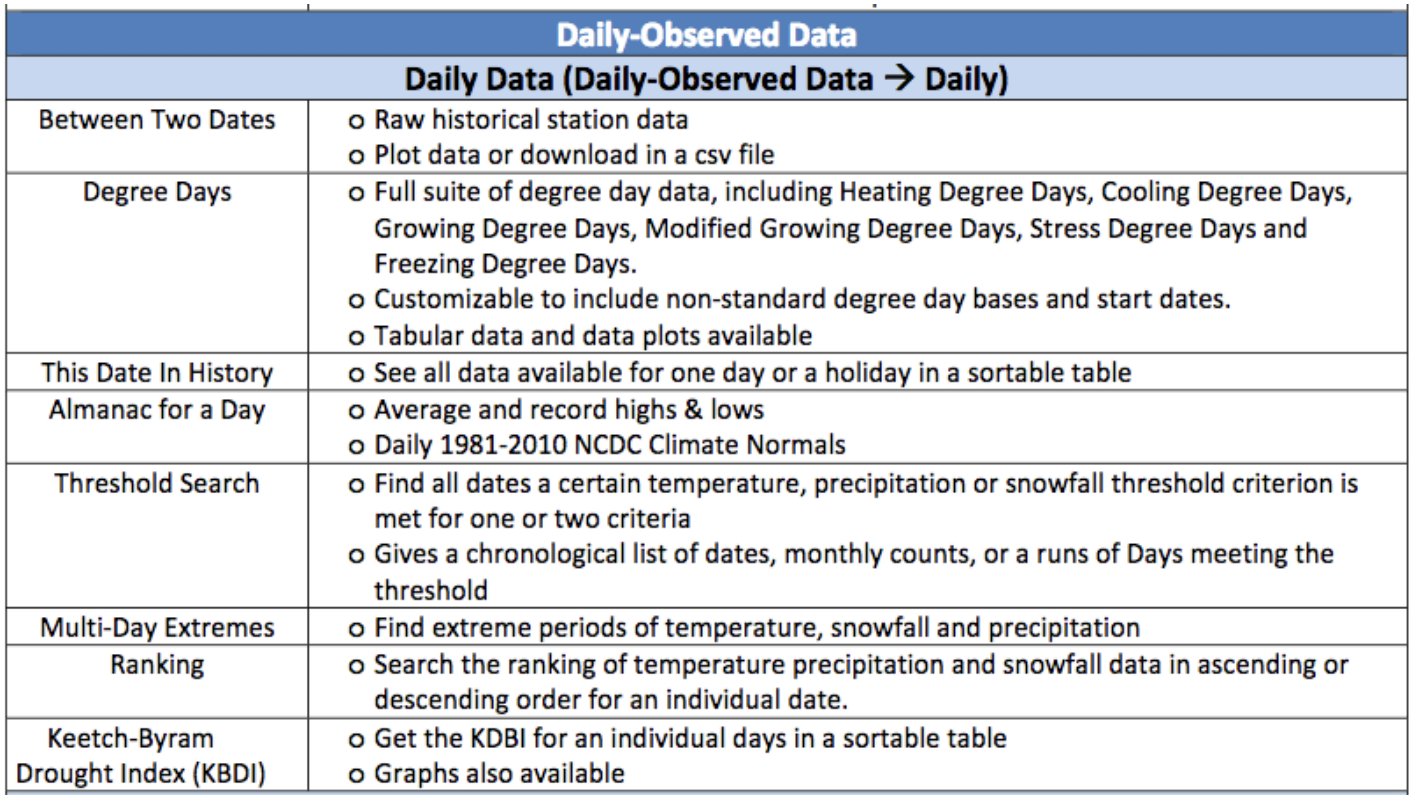 Figure 1: A list of the capabilities on the Cli-MATE application utilizing daily data.
The more recent web resource is also provided by a regional climate center, specifically the Southeast Regional Climate Center. The new tool is called the Southeast Climate Perspectives Map (https://sercc.com/climate-perspectives/), which may not sound very promising for those of us interested in the weather and climate of the Pacific Northwest, but actually includes data for the entire country. Moreover, it provides not just a tab for “Regional Map Perspectives” but also tabs for “Station Perspectives” and “Streaks & Thresholds Perspectives”. Its focus is on recent weather observations, and features a variety of ways of putting the recent weather in historical and geographic contexts. A good way to start is to simply go to the following easily navigable web site: https://sercc.com/climate-perspectives/. Use the Google interface to zoom in on the area of interest, and it’s off to the races. Here we do not attempt to describe all of the available features; those interested are advised to visit the product guide, or just rummage around. We feel that an especially intriguing feature is with the Station Perspective. Clicking on an individual station yields a table of how the average, minimum, or maximum temperatures or total precipitation over time scales ranging from 1 day to 2 years compare with historical records, including what days of the year they most closely resemble in the climatological record, and the most similar US city in terms of the climatological averages. This kind of query can be made for any day in the last 3 months. For example, the maximum temperature at Sea-Tac Airport (SEA) on 12 October 2017 was 50°F, which seems quite chilly. The application shows indeed that this value represents an anomaly of -11°F and was the third coldest 12 October on record. The most similar day of the year from a climatological standpoint based on maximum temperature is 19 November, and the most similar city in terms of the weather for the day is Juneau, AK. A partial view of the table of information that is provided is shown in Figure 2.
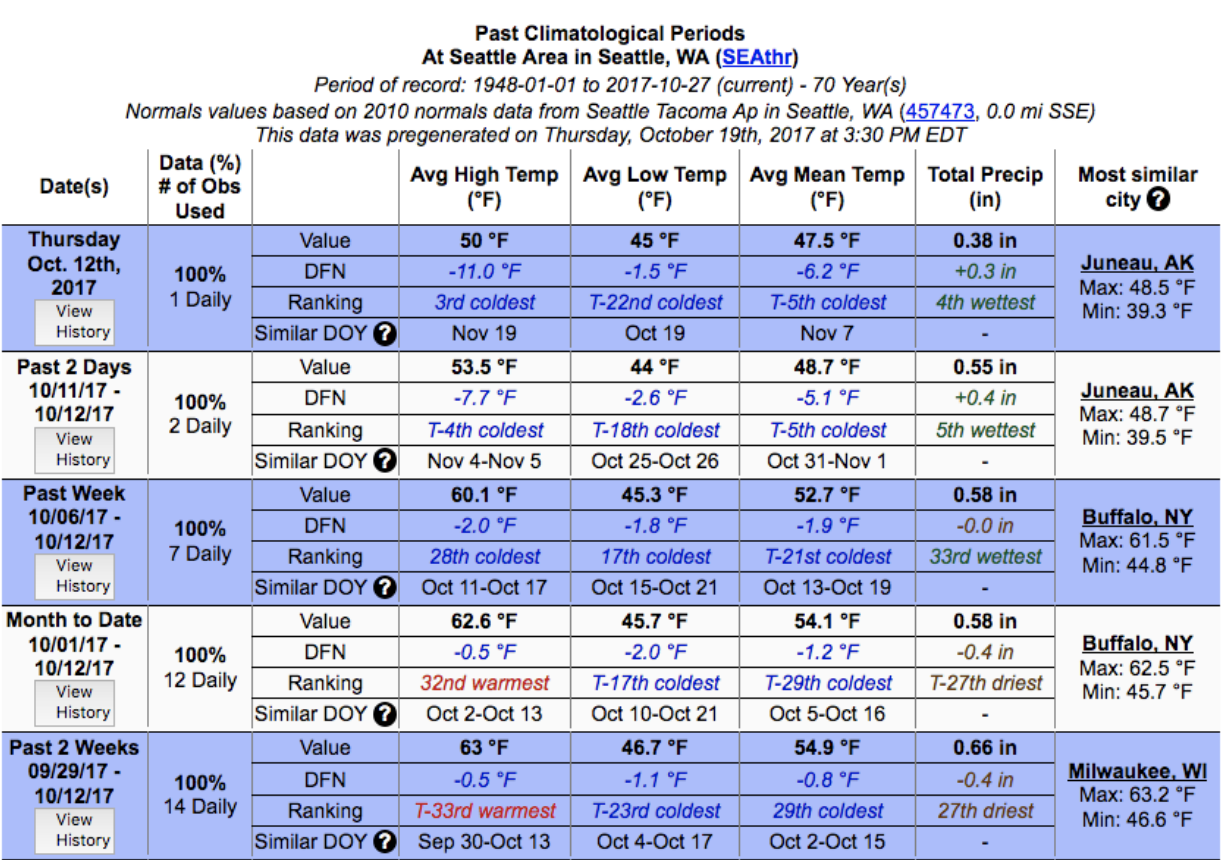 Figure 2: Example of daily to 14-day temperature and precipitation statistics and comparisons using the SeaTac AP site from the SERCC “Climate Perspectives” application.
We encourage our readers to check out the different kinds of information on these websites for themselves. But please don’t hesitate to let us know if you have questions about the information provided or can’t find what you need. We’re happy to assist!