By Nick Bond
We have already had some warm weather in WA during the past May, and rest assured more is on the way for the upcoming summer. While our temperatures do not tend to get as high as those in many other parts of the country, it can certainly get hot enough to represent a health risk, especially for vulnerable groups – which include young children and elderly as well as those with some medical conditions. Those that work outside are also at a greater risk of heat illness. In addition, the prevalence of air conditioning, particularly in western WA, is much lower than in other parts of the country. In recognition of this public health problem, the National Weather Service (NWS) has developed an experimental product for forecasting heat risk.
The new HeatRisk forecast product consists of color-coded maps of potential heat risk for the next 7 days available at the following web site: https://www.wpc.ncep.noaa.gov/heatrisk/ . This information is designed to supplement NWS heat advisories, watches and warnings because in some cases, actions should be taken before conditions are severe enough to warrant the issuance of those existing forecast products. The product also provides guidance for NWS forecasters when issuing heat advisories as it identifies which populations might be the most vulnerable in the specific situation. It is built from the NWS national gridded forecast database, and one value is assigned to each of the next 7 days. The factors that are taken into account are how large the warm anomaly is expected to be based on normal temperatures, the time of year (heat has been shown to have a greater impact on people early in the warm season), the duration of the warmer than normal temperatures, and whether or not temperatures will be low enough overnight to alleviate heat stress.
The HeatRisk product fits well with the “Integrate environmental forecasting services to support healthy communities and ecosystems” goal in the current NWS Strategic Plan. A cool (pun intended) feature of this new product is the ability to click on the map, and get a forecast for the next 7 days of the heat risk, maximum and minimum temperatures, and cloudiness/ precipitation in pictorial form at the selected location. An example of a map from late May 2018 is shown in Figure 1; note the fine detail related to terrain. An important distinction between the heat risk maps provided and other products is that these maps account for local effects, specifically how unusual the expected conditions are for the time of year and location.
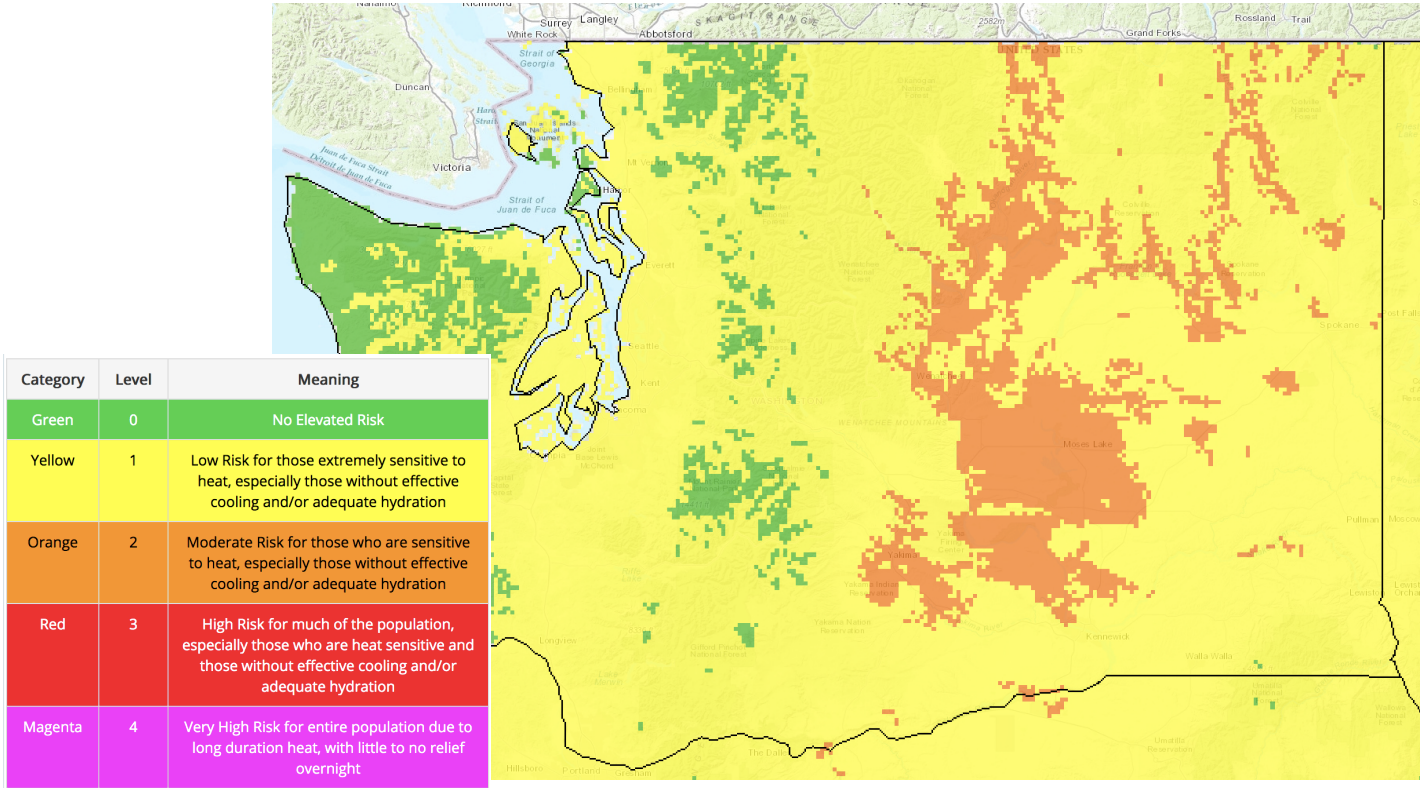 Figure 1: The experimental NWS Potential Heat Risk map issued on May 24, 2018 valid for May 28, 2018 (NWS).
The website listed above includes a description of the method used and how it compares with other products, and links to various sources with more information on extreme heat from the human health perspective. While many of us are looking forward to some warm weather this summer, I think most of us also would agree that it would be good if this web application does not get too much of a workout.