By Karin Bumbaco
OWSC, in partnership with UW’s Climate Impacts Group, is pleased to announce that our new Pacific Northwest Trend Analysis tool is now available for exploration: https://climate.washington.edu/climate-data/trendanalysisapp/. An older and outdated version of this tool using the Google Maps interface was formerly the most popular tool on OWSC’s website, allowing users to select and view trends in the PNW for temperature, precipitation, and snow water equivalent. The tool was migrated to Tableau (https://www.tableau.com/) and the upgrades made are highlighted here. We want to acknowledge the work of our former assistant, Matthew Rogers – now a graduate student at the University of Oklahoma – who primarily built the visualization.
The Trend Analysis tool allows the user to view time series and calculate linear trends in monthly average, maximum, and minimum temperatures, precipitation, and snow water equivalent (SWE) for any selected time period within the period of record for the particular station. Each of these variables is accessible using the separate tabs on the top of the visualization (Figure 1). For temperature and precipitation, the user can select stations in Washington, Oregon, Idaho or western Montana (hereafter “Pacific Northwest”) while the monthly snow water equivalent data (available on the first of January through April) is only available for Washington State. Seasonal averages (e.g., July through August or December through February) are additional options for the temperature and precipitation variables.
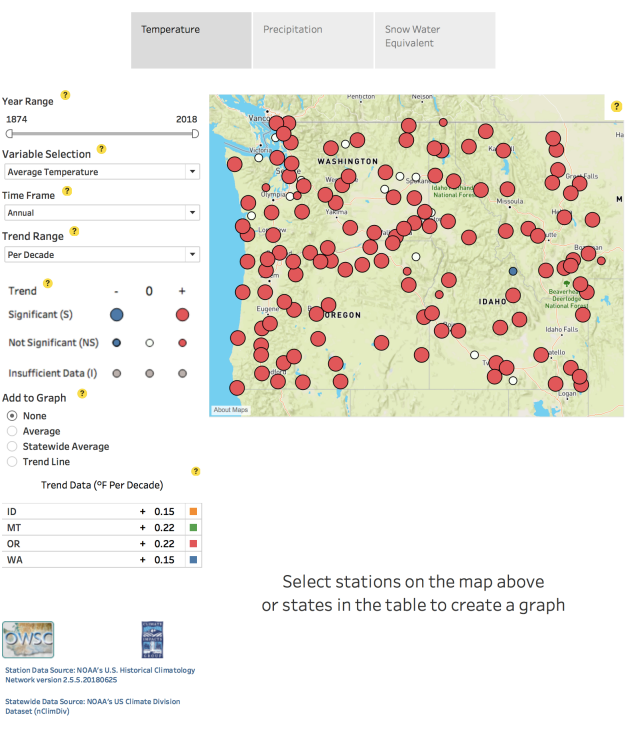 Figure 1: The homepage for the PNW Temperature, Precipitation, and SWE Trend Analysis Tool for average temperatures. Note the gray tabs on the top for diferent variables.
The primary goal of migrating the Trend Analysis tool into Tableau was to improve its functionality and aesthetics. But with rebuilding the interface came other opportunities for improvement. The tool now indicates on both the map and on the table on the left-hand side of the page whether the selected trend is significant at the 95% confidence level threshold. Figure 2a shows an example for fall average temperatures at Port Townsend and Cushman Powerhouse stations. The former has a significant warming trend as signified by the “S” in the legend while the latter is not significant (“NS”). The size of the station marker on the map is also determined by the significance of the trend with the larger circles indicating significance and the smaller circles lack of significance (Figure 2b). Hovering the mouse over each of the station markers shows the rate of change, as well as the elevation and the year range for each station. We use a two-tailed t-test with effective degrees of freedom to determine significance. Since short climate records can yield spurious trends, statistical significance is not determined for any time period less than 30 years, and gray circles are shown on the map instead.
 Figure 2a: Fall (Sept-Nov) average temperature time series for Cushman Powerhouse and Port Townsend on the Olympic Peninsula. The trend is not significant for Cushman Powerhouse but is significant at the 95% confidence level for Port Townsend.
 Figure 2b: Fall (Sept-Nov) average temperature trends at each station for the period of record. The large, red dots indicate significant increasing trends. The increasing temperature trend vastly outnumber the two significant, decreasing temperature trends (large, blue dots).
Some other properties of the tool include the ability to select any time period from the earliest data available, in 1874, to the most recent, in 2018. Another user-requested option is the ability to view the change in temperature, precipitation, or SWE per year, per decade, or over the entire period selected. The change in precipitation and SWE over the time period is also expressed in percent change, in addition to the absolute change in inches. Finally, the user has the option to select multiple stations at once, and average over those selections. A help guide for the map selection options (Figure 3) is included on the page with the Trend Analysis tool since the steps for selecting multiple stations may not be obvious. The user needs to select any of the last 3 options that appear under the “arrow” button as indicated in the help guide to select multiple stations from the map. The small, yellow circles with the question marks embedded throughout the visualization also provide some explanation of the various options.
 Figure 3: Key for how to control the map and select multiple stations.
Specifics on the data sets used in the Trend Analysis tool are described below, and links are provided for all of the data sources within the visualization. Enjoy exploring the new visualizations and please let us know if any bugs or glitches are encountered.
Data sources:
We used NCEI’s USHCN version 2.5 data for our monthly temperature input data, which uses an objective method to identify any non-climatic trends in the time series that may have resulted from station moves, urbanization, instrument changes, and changes in the time of observation (Menne et al. 2009). The objective method is based primarily on comparisons to nearby stations, and makes the dataset ideal for examining trends. The USHCN version 2.5 data also provides monthly precipitation data, but those data are not adjusted for systematic biases so more caution should be used in interpreting the trends there. The temperature and precipitation data included in the tool is for 137 stations spanning Washington, Oregon, Idaho, and western Montana. Statewide average temperature and precipitation data for the 4 states included in the visualization are from NCEI’s climate division dataset; even though only western Montana stations are included in the tool, the Montana statewide average is for the entire state. The monthly snow water equivalent (SWE) data are from the NRCS snow course data set for WA State only (49 stations), and did not undergo an additional quality control process beyond that carried out by NRCS.
Reference
Menne, M.J., C.N. Williams, and R.S. Vote (2009): The U.S. Historical Climatology Network Monthly Temperature Data, Version 2, B A MS, 993-1007.