Climatology of WA’s NE Olympic-San Juan Climate Division (#2)
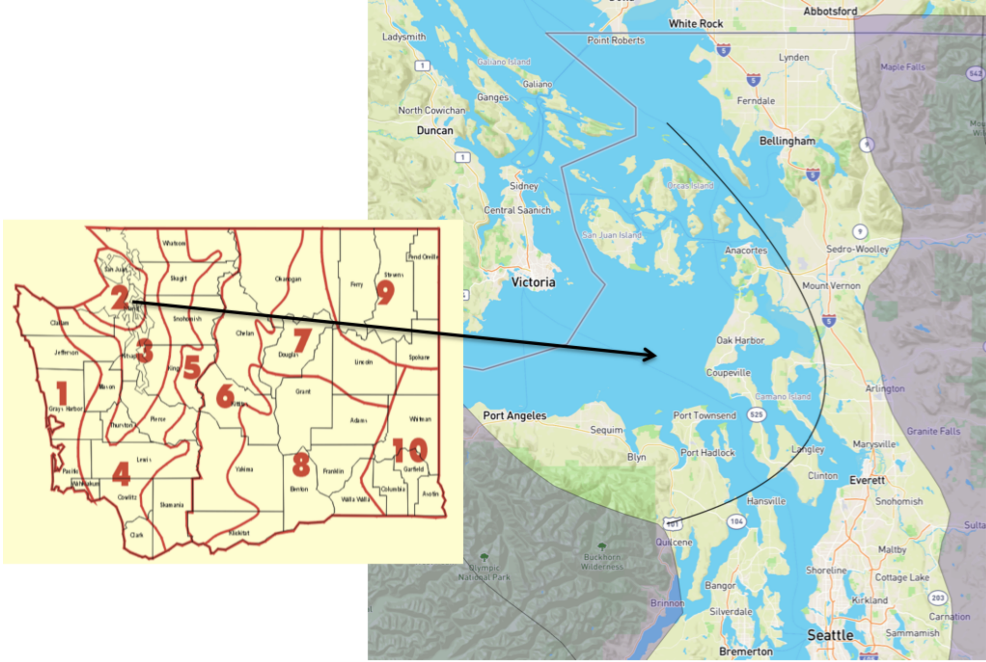
This is the second installment of the “Climate Divisions of WA” series, and we will focus on Climate Division 2 – the NE Olympic-San Juan Climate Division (Climate Division 1 is featured in the August 2018 edition of our newsletter). Figure 1 shows the geographical extent of the division, encompassing the farthest northeast portion of the Olympic Peninsula, a small western portion of Skagit county, and the entirety of Whidbey Island, Camano Island, and the San Juan Islands. It is the smallest climate division in area in WA, but the elevation ranges from sea level to 2,398’ on Mt. Constitution in Orcas Island. Principal municipalities include Anacortes, Coupeville, Friday Harbor, Langley, Oak Harbor, Port Angeles, Port Townsend, and Sequim. It also includes Native American reservations for the Jamestown S’Klallam, Samish, and Swinomish tribes.
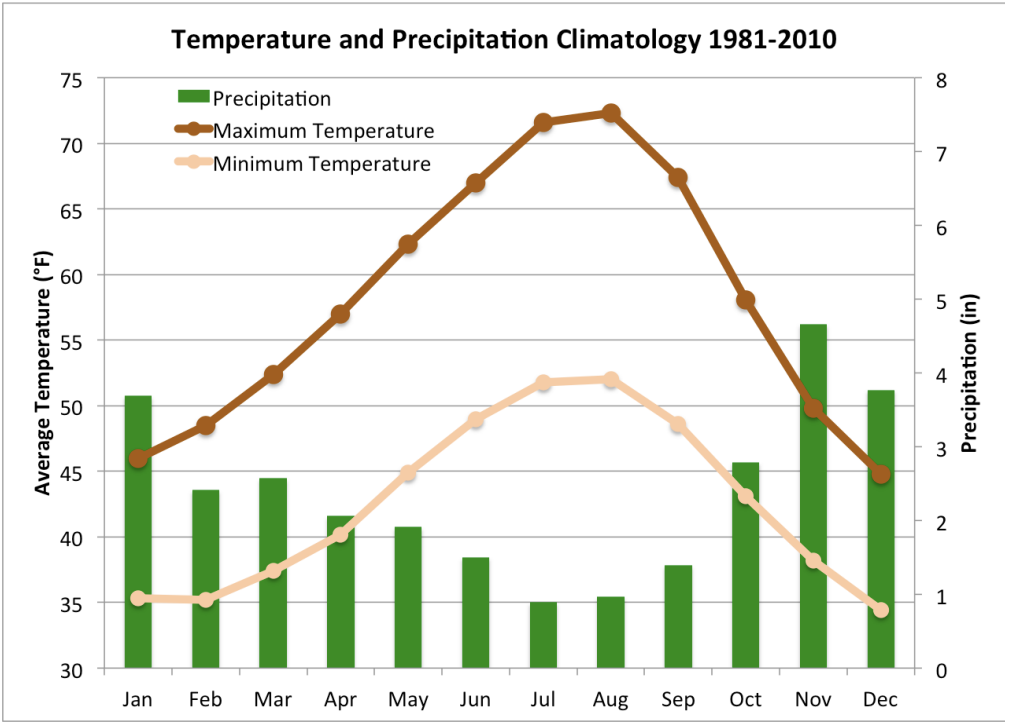
The 1981-2010 monthly climatologies for maximum temperature, minimum temperature, and total precipitation are shown in Figure 2. Typical of all Washington climate divisions, there is a distinct seasonality to the precipitation with the wettest month, on average, being November, and the driest month, on average, being July. With an annual average total precipitation of only 28.61”, climate division 2 is the driest division in western WA. This is a result of the rainshadow phenomenon caused by the Olympic Mountains. Similar to the Cascade Mountains, the Olympic Mountains receive copious precipitation on the windward side, and much scantier precipitation on the leeward side in association with the warming and drying of descending air. Western Washington’s wettest periods tend to be during southwesterly flow and in these situations, Sequim in particular experiences the protection of the higher terrain of the Olympics. It is often remarkably dry relative to locations only 10-20 miles away, receiving a meager 16” of precipitation annually. The effect of the rainshadow extends well out over the water, resulting in a local minimum in average rainfall in the vicinity of Coupeville. There are exceptions, of course. During our rare cold-air outbreaks, notably when the low-level flow is from the northeast, Sequim and Port Angeles often receive considerably more snowfall than other lowland locations in western Washington, as experienced during February 2019.
The maximum and minimum average temperatures follow the same seasonality as the remainder of WA state with the warmest month, on average, being August, and the coldest month, on average, being December (Figure 2). The temperature difference between the monthly maximum temperatures and the monthly minimum temperatures is smaller than was seen in Climate Division 1, for example, due to the moderating effect that the surrounding water has on the temperatures. In fact, if you don’t like extreme temperatures, you may want to look into buying some real estate. The average December through February winter temperatures averaged from 1981 to 2010 are actually the warmest (40.7°F) for any division in the state. Similarly, the all- time maximum high temperatures in summer are surprisingly low for a sampling of stations within the division. The all-time high temperatures for Friday Harbor (97°F), Port Townsend (96°F), Sequim (94°F), and Whidbey Island Naval Air Station (88°F) seem mild, especially considering that even Forks on the west side of the Olympic Peninsula has exceeded the century mark.
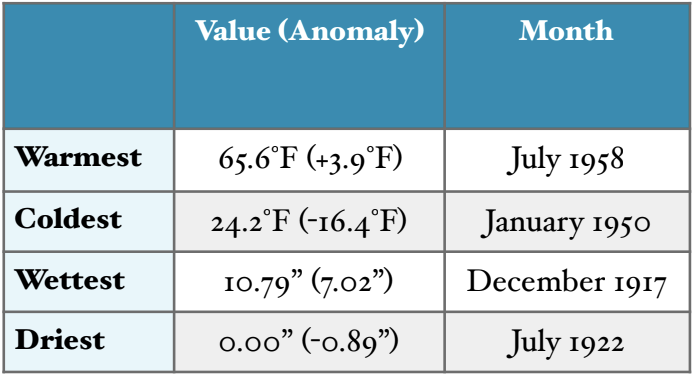
On the topic of extremes, Table 1 shows the warmest, coldest, wettest, and driest months for the climate division since 1895. The warmest (July 1958), coldest (January 1950), and driest (July 1922) months are the same months that were identified as those records for Climate Division 1, which is no surprise considering the large scale regional weather patterns that need to be in place to produce these extremes. The January 1950 anomaly is especially impressive for this climate division, with average temperatures a whopping 16.4°F below normal for the month. The record wettest month for the climate division (December 1917) occurred some time ago, with an anomaly of +7.02” that corresponds with some historically high streamflows in western WA.
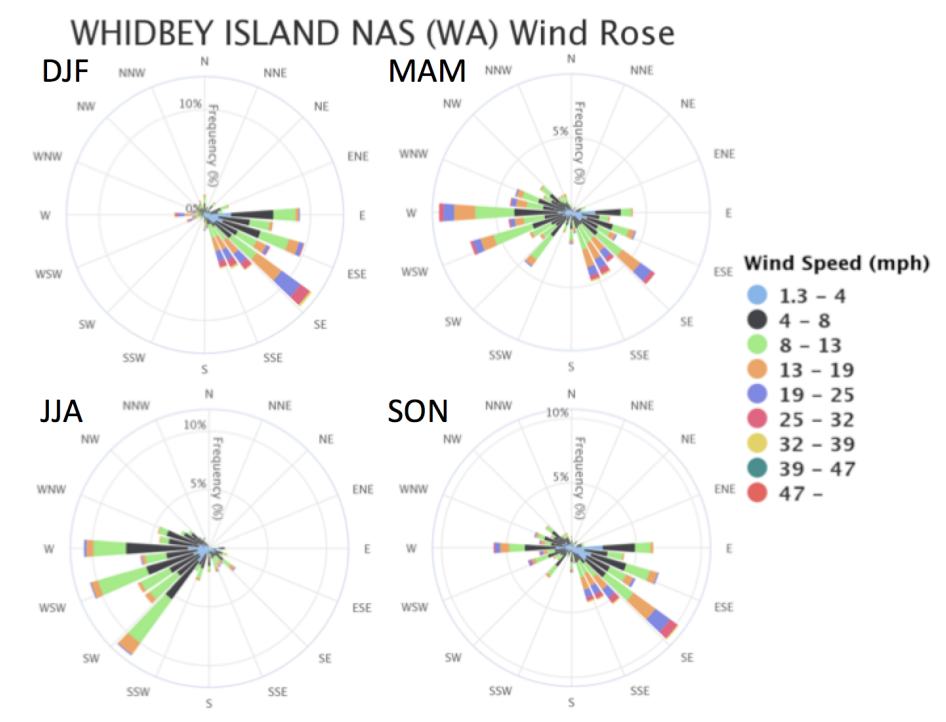
Seasonal wind rose charts for the Whidbey Island Naval Air Station are shown here as an example of the wind climatology for the climate division (Figure 3), though of course it only really represents one location. This station in particular is a windy one, thanks to its location on the northern NW coast of Whidbey Island (northwest of Oak Harbor), which exposes the station to westerly winds at the east exit of the Strait of Juan de Fuca. Those westerly winds are common in spring into early fall and are especially consistent during the summer due to high pressure off the coast of WA. Winter features winds almost exclusively from the south-southeast through east, in association with lower pressure over the ocean and higher pressure over the inland Pacific NW. Landfalling storms can be accompanied by prominent mesoscale pressure and wind perturbations, with especially rough conditions often occurring in Admiralty Inlet between Port Townsend and Whidbey Island.
In summary, the smallest climate division in WA state – the NE Olympic-San Juan division – also happens to have the warmest average winter temperatures in the state, is the driest division in western WA, and has relatively mild summer high temperatures. This is all thanks to the Olympic Mountain rainshadow and moderation by the surrounding waters. Please feel free to provide feedback on our Climate Division Series. Is there any special topic you’d like to see in subsequent series? Email/tweet/Facebook us (climate@atmos.washington.edu; @WAStateClimate).