By Nick Bond and Madeline Talebi
Ocean Weather Ship (OWS) Papa (P) at 50°North, 145°West was occupied almost continuously from December 1949 to August 1981 by the Canadian Weathership Program (Figure 1). These ships collected high-quality meteorological and oceanographic data that represent valuable time series for a remote location in the Northeast Pacific Ocean. The Ocean Climate Station (OCS) Program based at NOAA’s Pacific Marine Environmental Laboratory (PMEL) has maintained a moored buoy at Station P since 2007, and the observations from this buoy offer the opportunity to compare present with past conditions. The upper ocean apparently is freshening at this location, and there is interest in determining whether this trend can be attributed to a tendency for greater rainfall. With that in mind, a course of investigation led by Madeline Talebi, an undergraduate from the University of California, Irvine, was taken on under the auspices of JISAO’s 2019 Summer Internship Program.
 Figure 1: Location of Station Papa in the north Pacific Ocean (source).
There are often challenges working with historical data (which does not improve with age like wine!) and this project was no exception. The following account from Madeline describes the tortuous path that she took to collect, process, and eventually curate the OWS Station P data. Her efforts are of benefit to not just the OCS group at PMEL, but the entire community interested in air-sea interactions in the Northeast Pacific.
After countless dead ends, I was able to break some ground with the help of Thomas Cram at the National Center for Atmospheric Research (NCAR) when I was directed towards the International Comprehensive Ocean-Atmosphere Data Set (ICOADS) located on the NCAR website database. The ICOADS datasets are managed by Zaihua Ji. After narrowing a global dataset with various archived data to the specific coordinates of OWS P as well as making sure to include any and all of the significant meteorological data, I was able to compile most of what I was looking for. However, there is one hitch in this story. It seems that the one piece of data that has not been successfully found, at least based off of the research that I have done, are the precipitation accumulations. Based on publications having to do with ocean weather ships in general as well as Station P, precipitation measurements were usually measured every three hours in millimeters. This data, however, is said to have been “purged” according to John L. Knox. As discussed by Knox, the data was once archived, but has since been discarded due to the reasoning that this data would be of little use and significance in the future! The only precipitation measurements that have been gathered have come from “active or retired technicians, meteorologists, and oceanographers” who had worked on OWS P at some point [Knox, 1991]. Public access to these measurements seems to be limited or even nonexistent because I was unable to locate any definitive precipitation accumulation measurements. However, I did come across a paper by Gilbert Brian Tucker titled, Precipitation Over the N orth A tlantic. In his paper, he discusses how he derived an algorithm that pulls from the present weather codes in order to estimate precipitation accumulations. As acknowledged by several authors including John Knox, Mary Ann Jenkins, W. C. Wong, and Gilbert Brian Tucker, precipitation measurements were rarely taken on ocean weather ships due to the many difficulties in ensuring accuracy as well as precision. Factors such as the size, position, and type of rain gauge all had an effect on the amount of error that a rain measurement would have. As an aside, that is why the OWS P precipitation data is so valuable because very few weather ships even attempted to master this technique. Tucker’s paper was able to shed some light on an alternative route that uses present weather code data and three coefficients, X, Y, and Z, that are derived based on the ocean region in evaluation.
Since Tucker’s coefficients are directly linked to the North Atlantic, his coefficients are not practical for analysis in a region that is located in the North Pacific. However, Jenkins et al. (1993) were able to derive new coefficients with the algorithm that Tucker had utilized. For the purposes of specifying Station P precipitation, I focused on the 50 to 99 range because these are the codes signifying precipitation amounts that can be estimated using Tucker’s algorithm. It turns out there are only 6 of these codes (Figure 2; Table 1) that were reported often enough at OWS P to contribute meaningfully to precipitation totals, as also indicated in Jenkins et al. (1993).
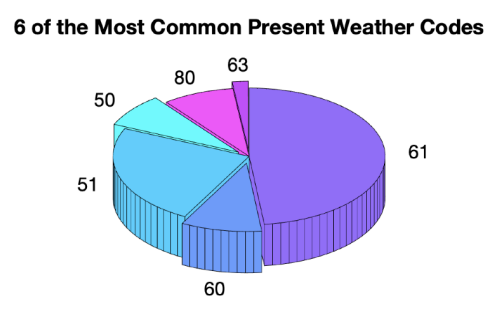 Figure 2: Fraction of reports including precipitation by present weather code category.
 Table 1: Descriptions of the 6 weather code categories used.
I used MATLAB and Tucker’s algorithm with coefficients indicated by Jenkins and Wong (1993) to generate time series of seasonal precipitation totals that are displayed in Figure 3. All of the data is from ICOADS except for a period from December 1972 to August 1979 when OWS is missing in the ICOADS data repository. This period was filled in with OWS P data previously collected by the University of Washington’s Applied Physics Laboratory (APL) for a project on ocean waves. The low amounts of precipitation at the very beginning and end of the weather ship deployment, i.e., the years of 1949 and 1981, are due to incomplete data (Figure 3).
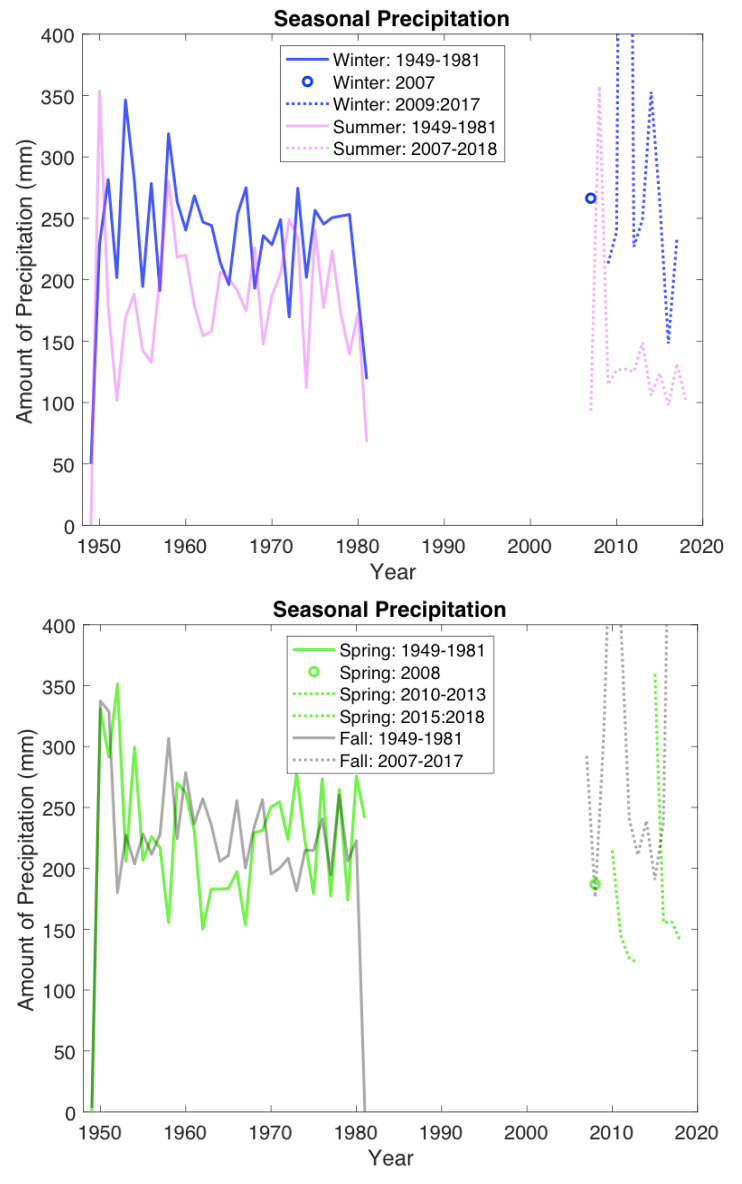 Figure 3: Total seasonal precipitation at OWS P estimated using present weather reports from the Canadian Weathership Program (solid lines) and observed by a moored buoy (dotted lines). The left panel refers to winter (blue) and summer (pink); the right panel refers to spring (green) and fall (black). The low precipitation seasons shown in 1949 and 1981 are the result of missing data.
The process of obtaining this data from Ocean Weather Ship Papa was quite the adventure. When one avenue led me to a dead end, I tasked myself with back tracking and problem solving to find the next avenue to pursue. I am pleased with the progress made thus far on this data quest, but I know that there is much more that can be analyzed in order to connect some missing links and draw conclusions. With what I have compiled, there does appear to be a general trend with the amount of precipitation. The more recent rain accumulation data spanning 2007 to 2018, as seen in Figure 3, illustrates an average increase in rain when compared to the 1949 to 1981 timeseries, especially for the fall season. So, what does this mean? At least the sense of the change in precipitation totals is consistent with the freshening at Station P, but whether it is the primary cause is yet to be determined.
References
Tucker, G. B., (1961): Precipitation over the North Atlantic Ocean. Quart. J. Royal. M eteorological Society, 87, 147-158.
Jenkins, M.A., W.C. Wong, K. Higuchi, and J.L. Knox (1993): Precipitation at Ocean Weather Station “P”. J. Climate, 7, 792-806.