By Nick Bond
The Summit at Snoqualmie Pass has the lowest base elevation (2,840’) of any ski resort in the western US. Given its low elevation and proximity to the Pacific Ocean and hence maritime air masses – the mean 850 hPa flow during winter is from the southwest at about 5 m/s – how is it cold enough to stay in business? The answer is no big secret, but then again, people are born every day that do not know why. The title of this piece is a giveaway and that is the common occurrence of easterly flow. During the winter, there is a tendency for lower pressure on the west side of the Cascades, the down-gradient flow that results draws relatively cold air from the interior of WA state through the Cascade Passes and locally lowers freezing levels. But that is by no means always the case during winter; the Cascades can also be subject to bouts of milder conditions and rain on the ski slopes (yuck!). How large are the variations from winter to winter in the extent of cold, easterly flow in the passes? Are there any long-term trends in this aspect of the winter weather of WA state? Here we take a crack at these questions.
Our quick look into this matter relies primarily on data from NASA’s Modern-Era Retrospective analysis for Research and Applications (MERRA) atmospheric reanalysis. We generally use the NCEP/NCAR Reanalysis for describing regional circulation patterns. Here we chose to use MERRA because of its superior horizontal resolution; the model representing its backbone has an approximate resolution of 50 km, or about 4-5 times finer than its counterpart for the NCEP/ NCAR Reanalysis. In particular, we have examined air temperature and zonal (east-west) wind profiles from MERRA at 6-hour intervals for the winters of 1981-82 through 2018-2019 at 47.5°N, 120°W, a location just north of Wenatchee, WA in the foothills on the east side of the Cascades. Surface temperatures for the East Slope Cascades Climate Division (#6) of WA are also considered.
We begin by examining winter (December through February) average temperatures at the 925 hPa level from MERRA at our reference point, along with the directly- observed surface temperatures in Climate Division #6, as shown in Figure 1. Not surprisingly, there is a strong correspondence between the two time series; the linear correlation coefficient between the two time series is ~0.91. More intriguing are that the surface temperatures are about 6°F colder than those from MERRA at the 925 hPa level,which is at an altitude of about 2700’ or very roughly 1000-1500’ above the mean elevation of Division #6. In other words, it makes sense that air temperatures in Snoqualmie Pass, and for that matter the other Cascades passes, are relatively cold when the chilly air near the surface is forced up the east flank of the Cascades and through the gaps in the terrain. While the 38-year record is rather short to say anything meaningful about long-term trends, fitting lines to each series indicates an overall increase of about 2.8°F in the 925 hPa free air temperature and about 1.8°F in the surface temperature, with plenty of year to year fluctuations. OK, the climate is warming…but what about the frequency of east winds keeping the passes cold?
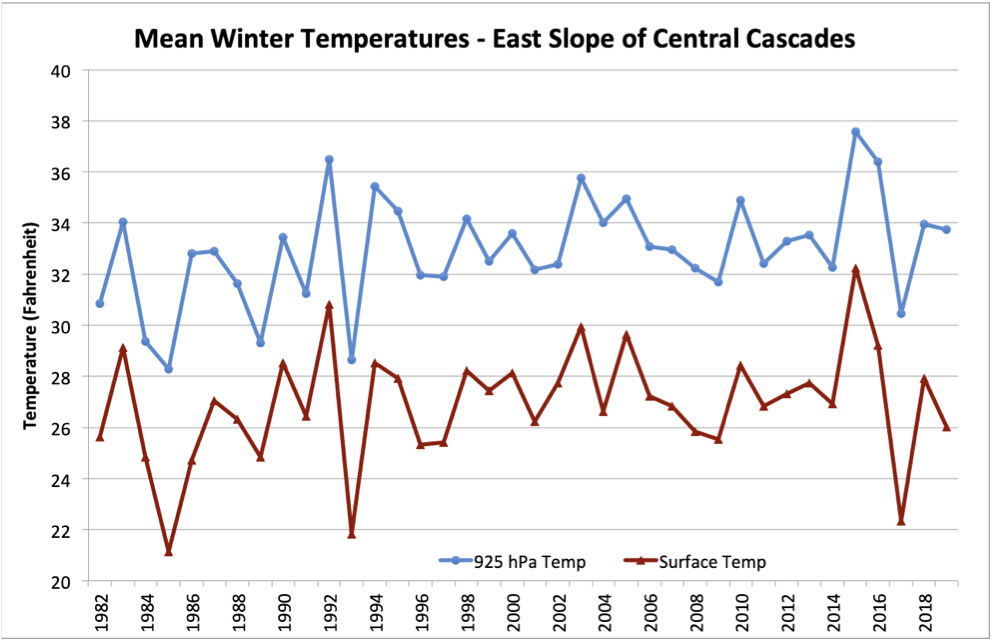 Figure 1: Mean winter (Dec-Feb) temperatures (Fahrenheit) at 47.5°N, 120°W at 925 hPa from MERRA (blue) and for WA Climate Division #6 (red) for the years of 1981-82 through 2018-19.
Measures of the overall duration of east winds each winter from 1981-82 to 2018-19 for our reference point has been determined using MERRA. More specifically, we counted up the number of hours for which the winds at 900 hPa had an easterly component and the temperatures at the 925 hPa were below 0°C. We also counted the number of hours for which these conditions were met and the temperatures at 850 hPa were warmer than -2°C. These are situations with a statically-stable temperature profile and the potential (but by no means the guarantee) for multiple freezing levels and freezing rain. The latter conditions are no picnic for folks out for some winter recreation, and a real headache for the WA State Department of Transportation from a road safety perspective. Seasonal totals for the two categories of east winds are plotted in Figure 2. Note the large year-to-year swings in the measures chosen to characterize the duration of east winds in the central Cascades. As an aside, the years with more east winds are not that snowy. For example, the winter of 1998-99 had the lowest duration of cold easterlies; this winter featured a strong La Niña and the highest total snowfall at Snoqualmie Pass, and record snowfalls elsewhere, notably at the Mt. Baker Ski area. The correlation coefficient between the duration of easterly flow (top trace in Fig. 2) and the total snowfall at Snoqualmie Pass is about -0.4. This stands to reason in that big snow dumps in the Cascades generally occur with northwesterly flow. But back to the question posed above: Figure 2 indicates that the trends in duration of easterly flow over the 38-year record considered are negligible, at least with respect to the measures used here. The bottom line is that the central Cascades still seem to be experiencing about as many hours of cold, easterly flow during winter as they were a few decades ago. That being said, we are expecting the tendency for those east winds to be not as cold in future decades, simply because of continued warming of near-surface temperatures east of the Cascades.
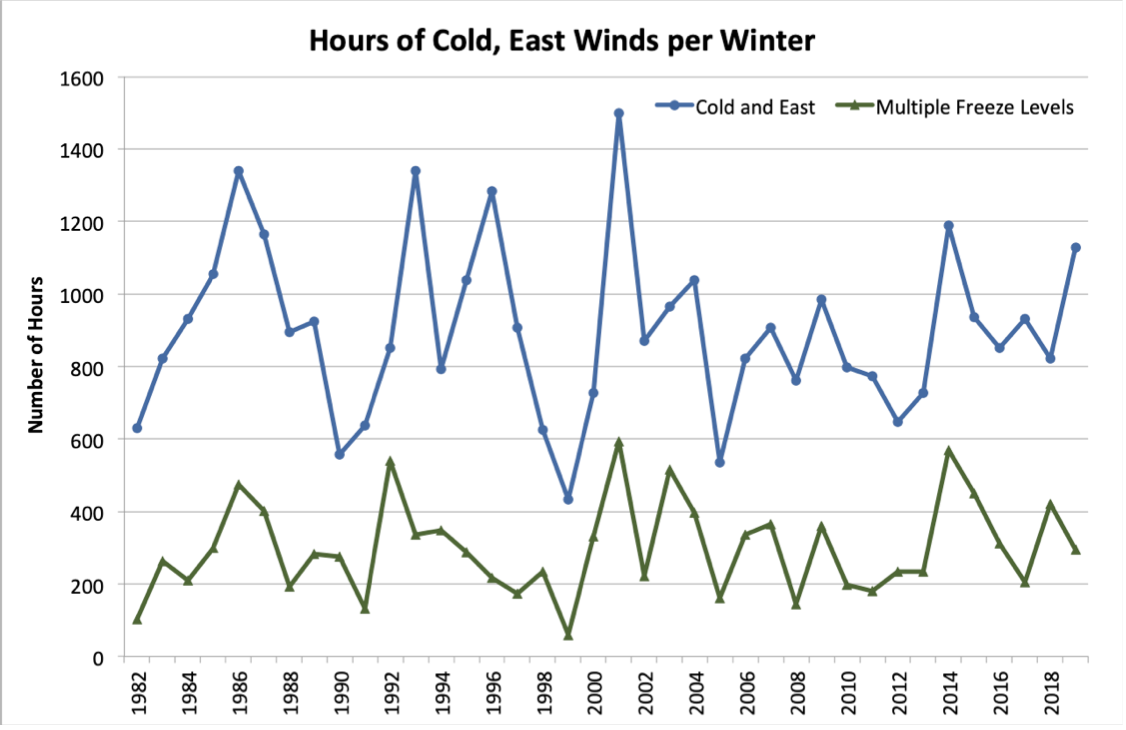 Figure 2: Total duration in hours of cold, easterly flow at 47.5°N, 120°W from MERRA (blue) and for that subset of hours including air temperatures greater than -2°C at 850 hPa (green). See text for details.