By Karin Bumbaco
Recent cold overnight temperatures during Thanksgiving weekend 2019 have illustrated the variability from place to place that can emerge this time of year. There are many locations in WA state in which observing stations are not that far apart, but minimum temperatures vary substantially, particularly on clear, cold nights. In this piece, we use just one example in the central Puget Sound region: Everett Snohomish County Airport, i.e., Paine Field, and Arlington. The Everett station is about 21.5 miles south-southwest of Arlington, as the crow flies (Figure 1).
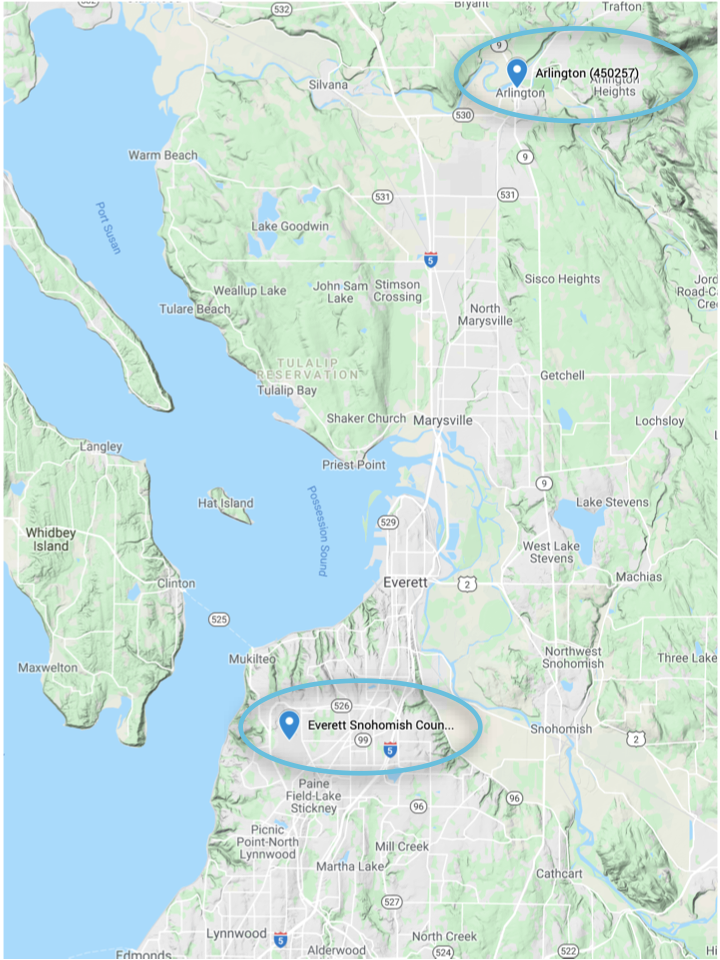 Figure 1: A zoomed in map of the central Puget Sound, showing the locations of the Everett and Arlington stations (blue markers).
We focus on the December and January days for Arlington (450257) and Everett Snohomish County Airport (452670; hereafter just “Everett”). Due to missing data for each station, we use the period of overlap, 2006-2018, which is a relatively short 13-year record. Nevertheless, since a total of 806 December and January days are considered, the relationship between the stations is considered robust. Importantly, Everett is at 606’ elevation while Arlington is at 100’.
Figure 2 shows two scatterplots – one for maximum temperatures (Tmax) and one for minimum temperatures (Tmin) – with each marker representing one day. Tmaxs (Figure 2a) generally have a 1:1 relationship between the two stations. Arlington does tend to be a degree warmer on these winter days, on average, though it certainly isn’t always the case. The correlation coefficient for Tmax is 0.90 showing a fairly strong correspondence. Tmins (Figure 2b), on the other hand, are generally warmer in Everett compared to Arlington. On average, Everett Tmins are 6°F warmer than Arlington. The correlation coefficient is significantly lower for min temps at about 0.83.
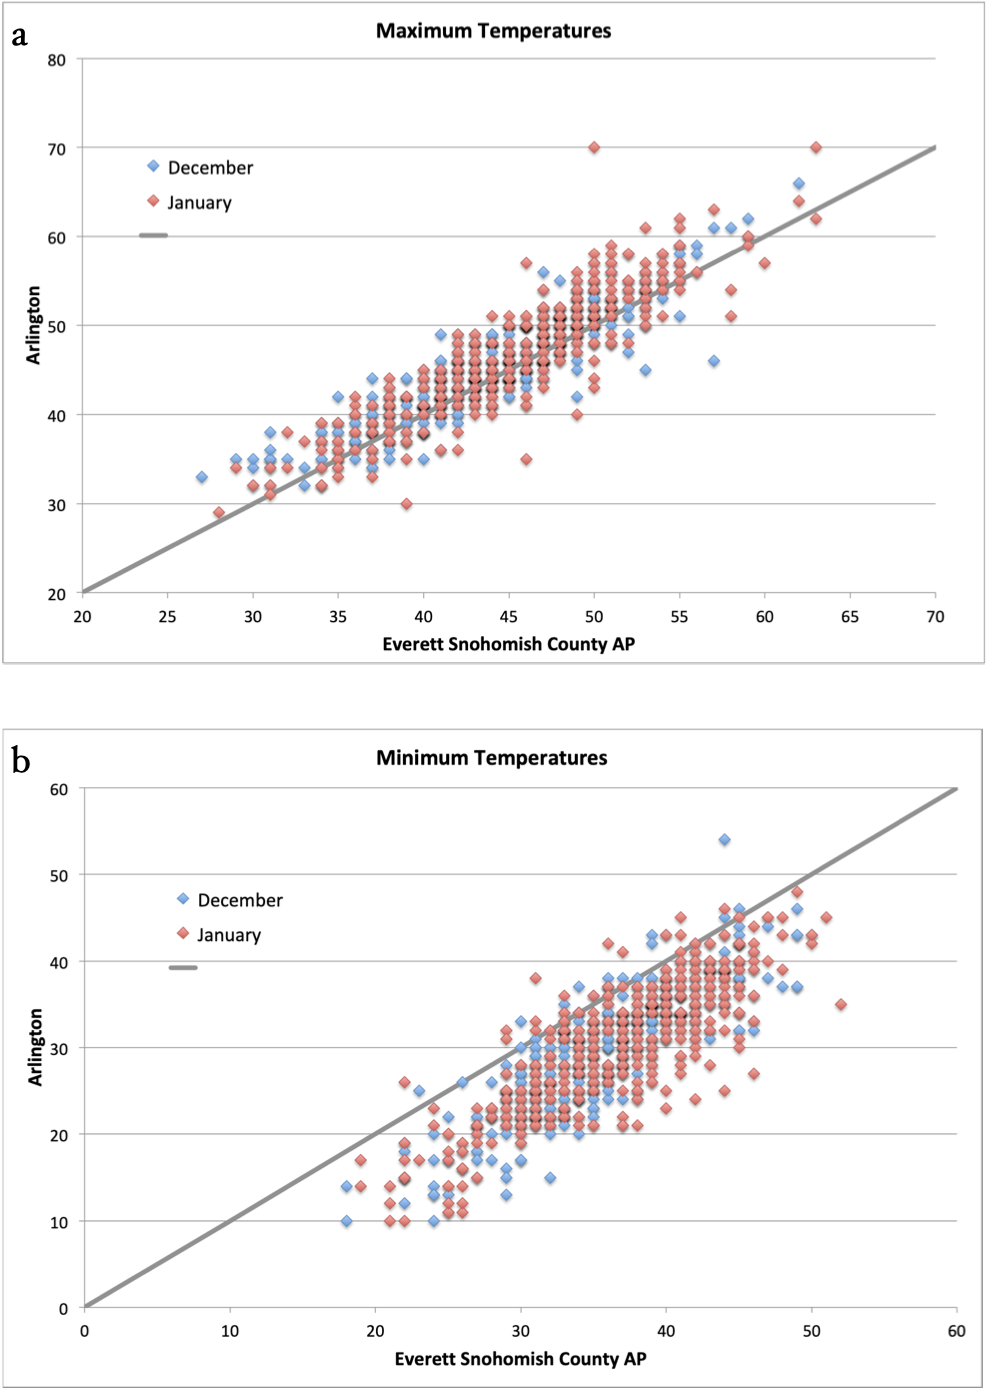 Figure 2: December and January 2006-2018 (a) maximum temperatures (Tmax) and (b) minimum temperatures (Tmin) for Arlington vs. Everett compared to a 1:1 relationship (gray line).
So why the difference? The Everett station is located on an isolated plateau that tends to stay warmer overnight compared to Arlington’s location in a valley where the coldest air settles. In addition, the former is situated only about 2 miles from Puget Sound, while Arlington is about 10 miles away from that moderating influence. We also see a marked difference in Tmins between Tacoma and SeaTac AP, with SeaTac’s plateau location also resulting in warmer temperatures on clear nights with prominent radiational cooling. On the other hand, there are some stations spaced close together, such as Spokane Felts Field and Spokane International AP in which we don’t see much difference in either Tmaxs or Tmins. A crow needs to fly only 10.5 miles from one station to the other, with the city of Spokane in between. The correlations between daily December and January values of Tmax and Tmin are 0.96 and 0.97, respectively, with a much greater 1:1 correspondence between the stations (not shown). While Spokane International AP is at an elevation 420 feet higher than that of Felts Field, it is situated on a broad plain rather than an isolated plateau, and so the cold air that forms near the ground has nowhere to go. Felts Field is also in close proximity to the Spokane River, and perhaps that helps moderate temperatures during cold winter nights. A specific example of a recent clear, cold night in western WA is shown the air temperature map for 7 am on Dec 5, 2018 (Fig 3). The Everett station is in the 23-32°F band, while Arlington is located in the 14-23°F band. The Tmin on the 5th was 29°F and 15°F for Everett and Arlington, respectively, quite a large difference for stations relatively close. Note the other cool spots that emerge on the map, such as south of Olympia, showing the substantial differences in Tmins that can develop on clear winter nights. The lower foothills of the western slope of the Cascades also tended to be warm in this example, as is typically the case, due to drainage of the cold-air that develops near the surface.
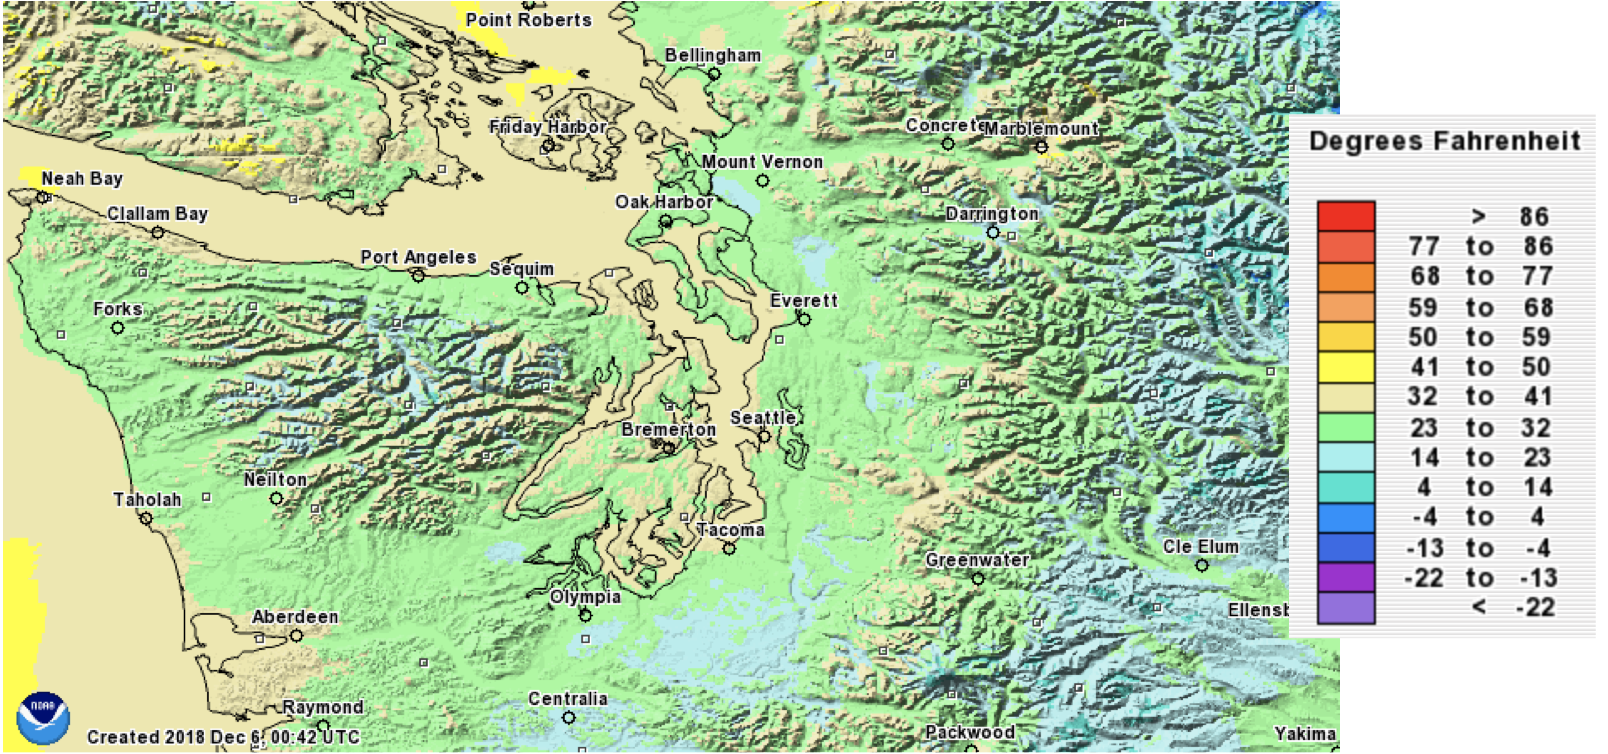 Figure 3: Modeled surface air temperatures from NOAA’s Operational Hydrologic Remote Sensing Center from 7 am PST on December 5, 2018.
Numerical weather prediction (NWP) models struggle to reproduce the surface-based temperature inversions that occur during clear, calm winter nights, and hence the corresponding spatial variations in surface temperatures. But since these variations are so closely tied to the local terrain and land-water differences, they are systematic. In other words, you probably already know if you live in a warm versus a cold spot.