Snow Depth versus Snow Water Equivalent in the Cascades of Washington State
Winter has arrived in earnest and the snow is finally starting to pile up in the mountains of Washington state. There are two principal measures of the snowpack: snow depth and snow water equivalent (SWE). Skiers and snowboarders tend to care more about the former. Water managers mostly monitor the latter, since SWE represents the amount of water in the snowpack that helps get us through our dry summers. The density of snow can vary substantially, of course, with colder temperatures typically associated with light, powdery snow and warmer temperatures associated with the wet, dense snow sometimes known as “Cascade concrete”. But day in and day out, and for snowpack in WA as a whole, how do they relate to one another? In other words, knowing one do you know the other? There has been a lot of work on this subject, with recent work even developing a simple snow depth to SWE conversion (Hill et al. 2019), but let’s take close look at a few WA stations.
Towards that end, we draw upon daily data from 5 stations along the spine of the Cascades, from north to south Harts Pass (6490’), Stevens Pass (3950’), Stampede Pass (3850’), White Pass (4440’) and Lone Pine (3930’) from the Natural Resources Conservation Service (https://wcc.sc.egov.usda.gov/reportGenerator/). Relatively complete data sets for snow depth at these stations only go back to about 2007, so we will be examining relationships between depth and SWE rather than trends. This period did feature some cool, snowy winters such as 2010-11, and some much more miserable examples, especially the warm drought year of 2014-15. Data from the months of January and April are considered, with a focus on the ratio of depth to SWE.
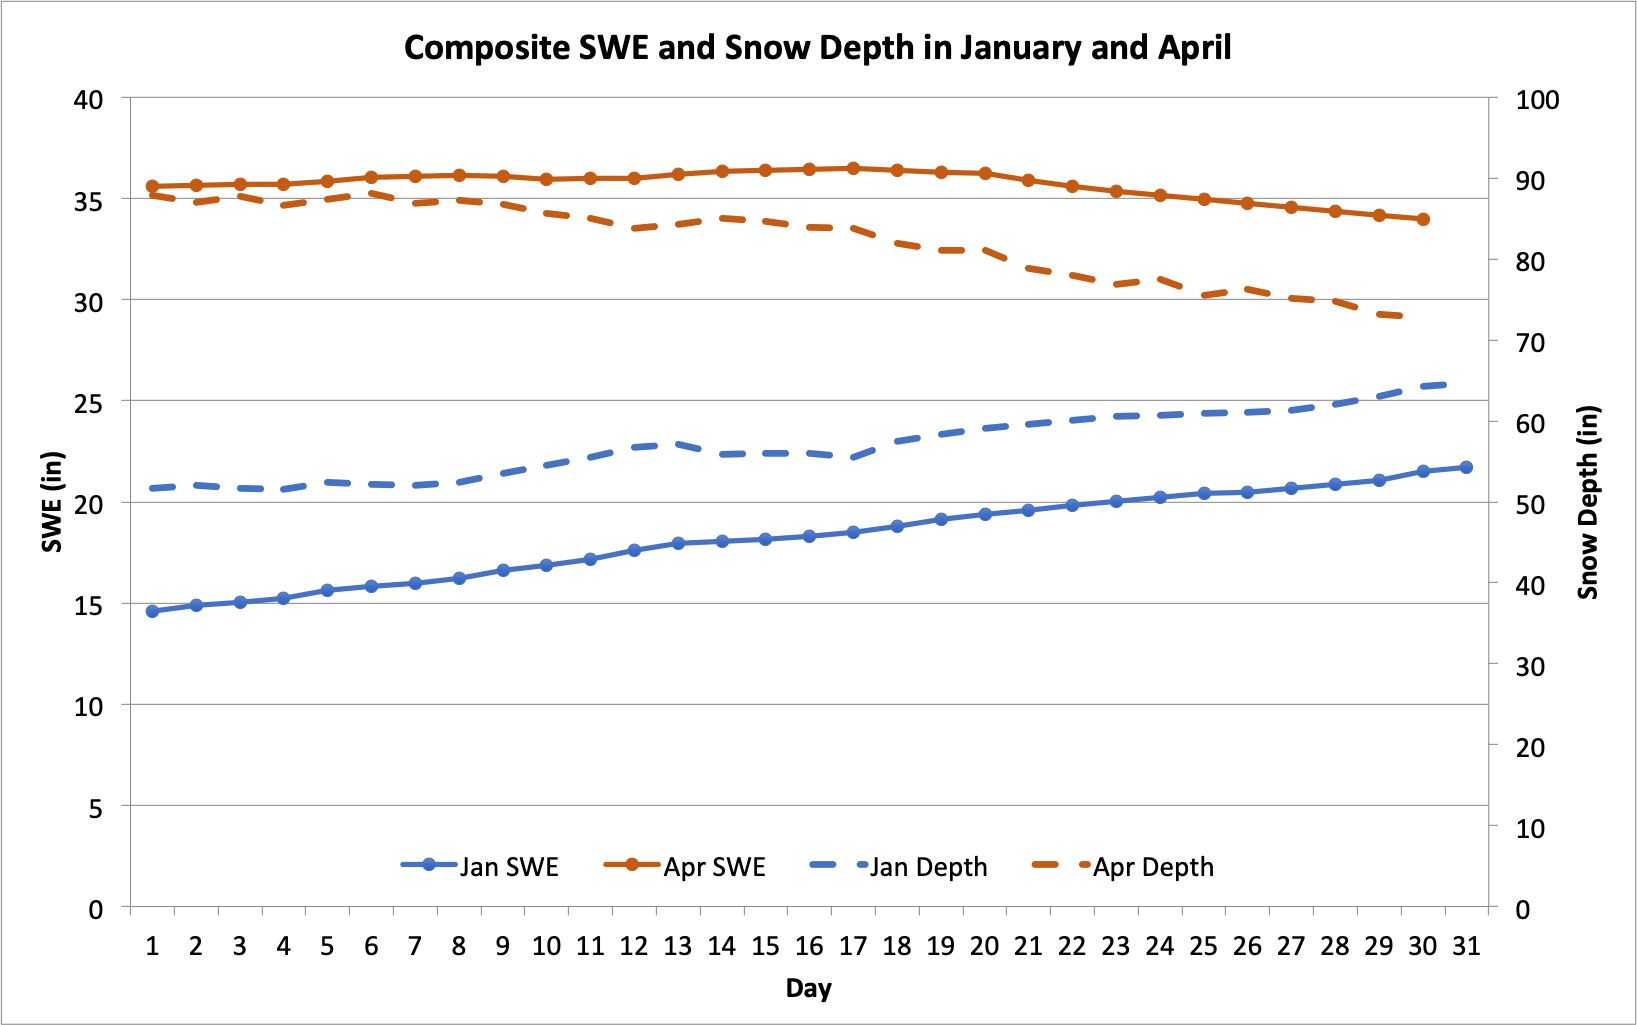
First, we averaged all the data for each day of the month at each site, and then formed a grand average for the 5 sites. The results of this exercise are shown in Figure 1. On average, January starts out with a depth and SWE of 51.6 and 14.6”, respectively, and ends with a depth and SWE of 64.6 and 21.7”. Over the course of the month, there is greater growth in a proportional sense in SWE than in depth. More specifically, the average ratio of depth to SWE goes from about 3.5 to 3. The month of April starts out with an average depth and SWE of 87.9 and 35.6”, respectively, and ends up with 72.8 and 34.0”. By the end of the month that ratio is only about 2.1. This signifies a very “ripe” snowpack, with the high water content of the snow implying that melting is underway or imminent.
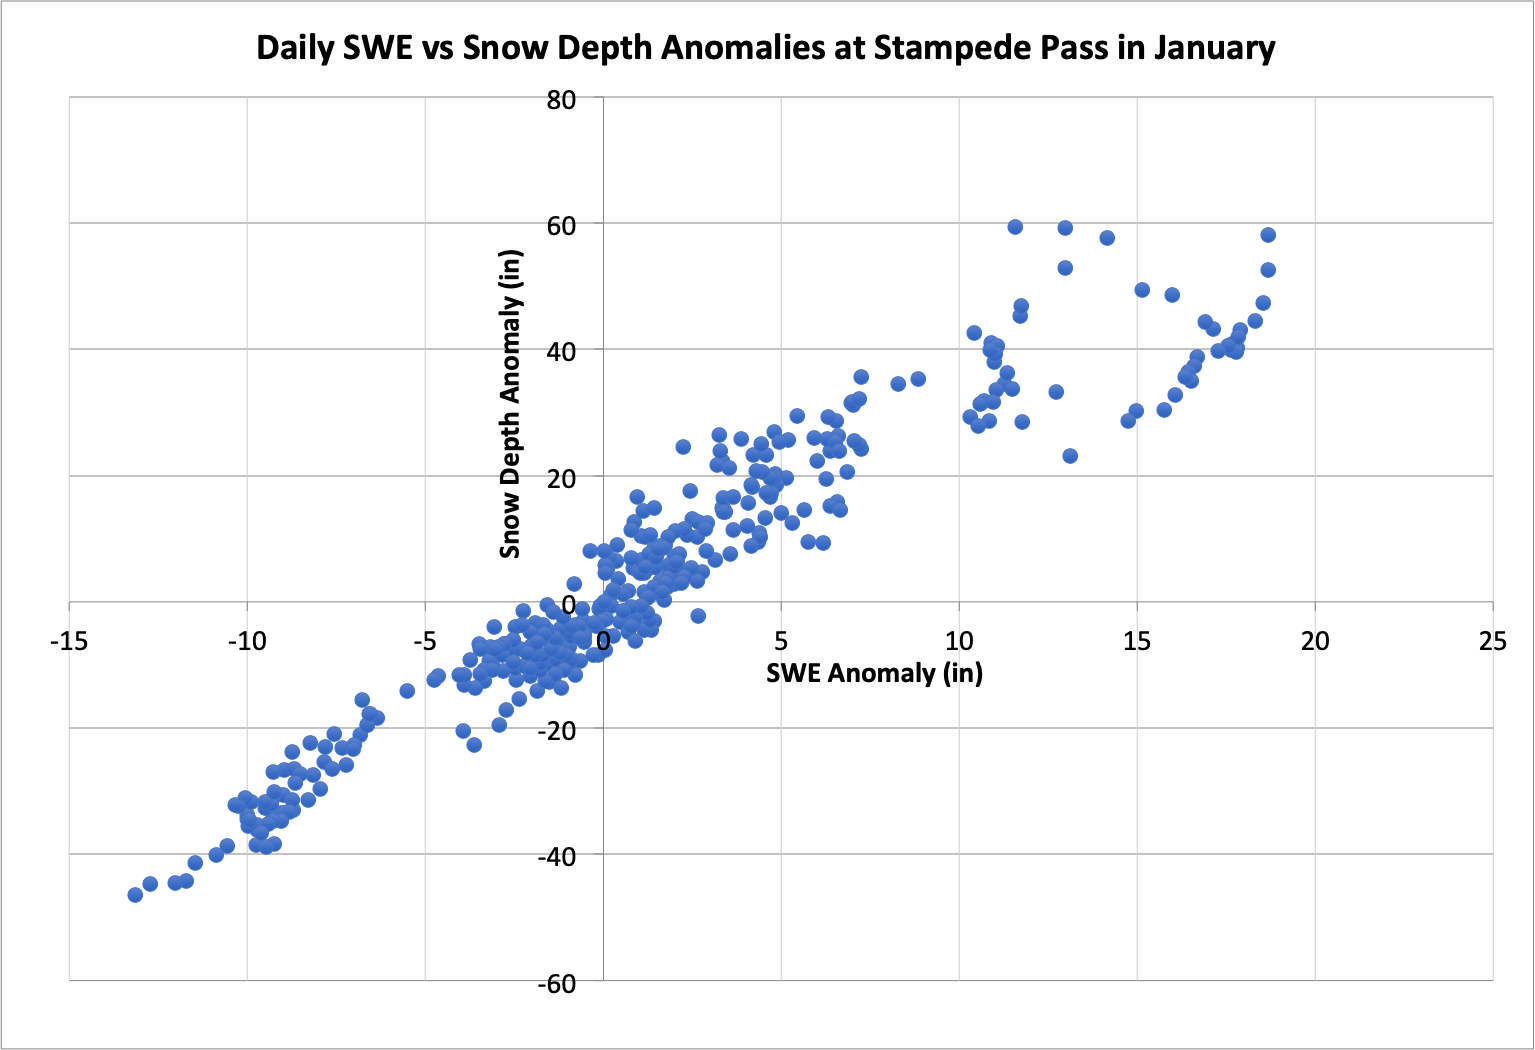
We next examined the daily variability in snow depth and SWE. Correlations between daily values considering all years during January was between 0.92 and 0.96 at four of the sites; Harts Pass was somewhat lower at 0.86. During April, the correlation coefficient was between 0.90 and 0.96 with Harts Pass again exhibiting the most variability. Removal of the daily climatology and hence the seasonal cycle in the ratio between snow depth and SWE did not impact the correlation much – the year-to-year variability is much greater than that effect. This is illustrated in a scatterplot of daily anomalies in depth and SWE at Stampede Pass for the month of January (Figure 2). We were struck by the tightness of the linear relationship between the two variables, with the exception of the very highest values of SWE, which apparently can be accompanied by a sort of roll-off in snow depth anomalies.
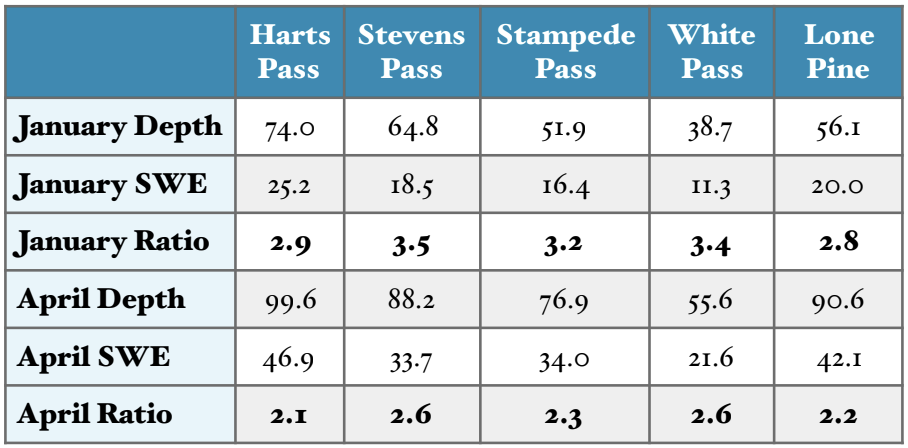
We next explore the possible differences between stations and years. Table 1 shows mean snow depths and SWEs, and their ratio, for each of the five stations in January and April. We were surprised to see that this ratio was on the low side(i.e., there tends to be denser snow) at Harts Pass since it is at a higher elevation than the others. Could this be attributable to it getting snow earlier in the season that then packs down, or could some other factor be at play? One might suppose that there are substantial year-to-year fluctuations in the ratio of depth to SWE and so we looked into that. Our approach was to calculate the average depth and SWE at each station during the month of January for each year; the results are plotted in Figure 3.
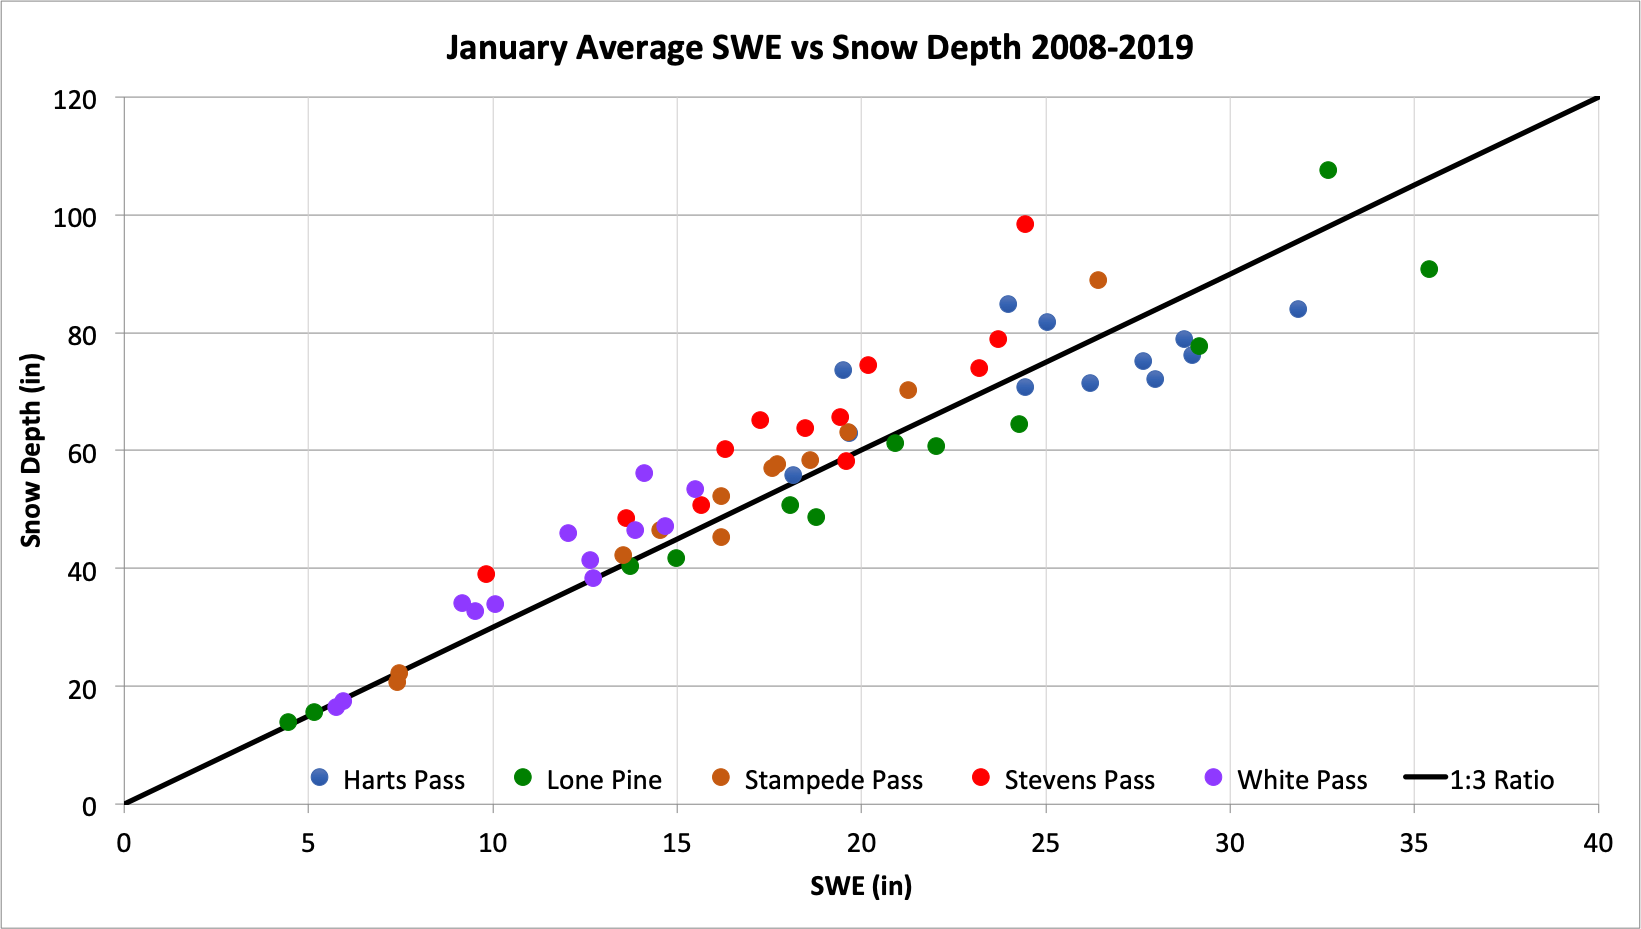
Again, we found a remarkably tight correspondence between the two measures of the snow pack. We expected that warm years with disproportionate amount of rain versus snow would lead to lower ratio of depth to SWE but does not seem to be the case. Perhaps this effect is effectively countered by the extra weight of a thicker snowpack, leading to compression.
A takeaway from our quick analysis is that the snow depth strongly co-varies with SWE in the Washington Cascades, at least at the locations considered here. This may have implications for monitoring the SWE in our mountains in a cost-effective manner using remotely-sensed snow depths from lidars or the equivalent.
Reference:
Hill, D.F. and CoAuthors (2019): Converting snow depth to snow water equivalent using climatological variables. The Cryosphere, 13, 1767-1784.