By Nick Bond
We have used this space to discuss ocean temperatures a number of times in recent years. Here, we will again consider water temperatures, but in this case for Washington State rivers, with a focus on the spring season. Salmon and trout suffer if the water becomes too warm. A vivid example of these impacts was represented by the snow-drought year of 2015. A record run of adult sockeye salmon entered the Columbia River that year, but relatively few reached their spawning grounds due to exceedingly warm water temperatures. The Columbia River at The Dalles, for example, had a mean June temperature of 19.3 C, which was 3.2 C warmer than normal. With that kind of an event in the recent past, we will take a look at the stream temperatures this spring to date, and the strength of the correspondence between seasonal mean stream temperatures and air temperatures.
A number of other groups have investigated this topic. For example, Isaak et al. (2012) documented the trends in seasonal mean stream and air temperatures in the Pacific Northwest, and showed that they generally tracked one another. Though, this study included a sole location in Washington: the Snake River near Antone in the southeast corner of the state. Our modest effort to complement this and other previous studies was hampered by the lack of data easily available online. There is much more streamflow/discharge data than stream temperature data, particularly on unregulated streams. That being said, we forged ahead and grabbed daily data for two streams: the Nooksack River at Ferndale and the Okanogan River at Malott, to illustrate water temperatures during April and May of 2020. We also collected seasonal mean temperatures for April through June for those two rivers, and three others (the Cedar River at Renton, the Tolt at Carnation, and the Columbia at The Dalles) for the years of 2005-2019. The spring temperatures in those 5 rivers are compared with air temperatures for WA state as a whole. The water temperature data was downloaded from the following website: https://waterwatch.usgs.gov/wqwatch/map?state=wa&pcode=00010
The time series of daily water temperatures for the Nooksack and Okanogan Rivers during April and May of 2020 are shown in Figs. 1a and 1b, respectively. The Nooksack ran a bit on the warm side, with considerable variability on daily to weekly time scales and an evident diurnal cycle. The Okanogan had comparable swings in temperature on weekly time scales. Both rivers had temporary maxima during the middle of April, and from 8-12 May, during periods of seasonally warm weather. The big decline in temperature for the Nooksack at the very end of May can be attributed to the cool and wet weekend that closed out the month. Even though the two rivers are in different parts of the state, and the Okanogan is subject to greater control/ regulation, we were struck by the similarity in their temperatures during the two-month period.
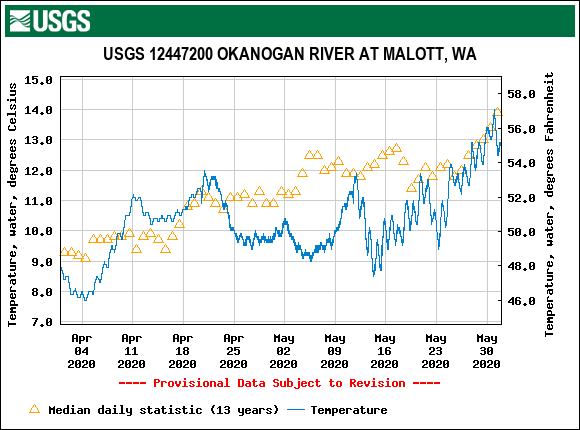 Figure 2a: Daily values of water temperature for the Okanogan River at Malott during April and May 2020. The gold triangles refer to median values for the date.
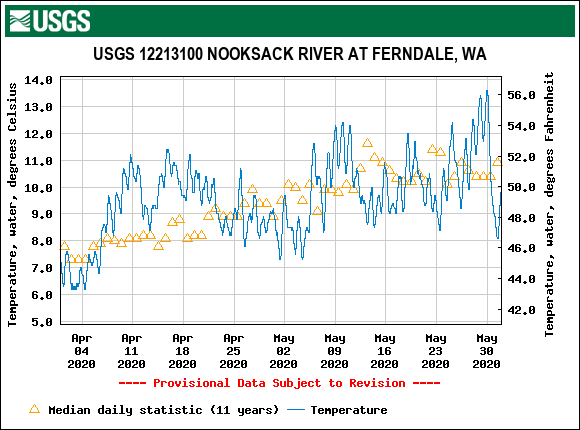 Figure 1b: Daily values of water temperatures for the Nooksack River at Ferndale during April and May 2020. The gold triangles refer to median values for the date.
The similarity between stream temperatures also pertains to seasonal mean values. Figure 2 shows April through June average water temperatures for the years of 2005 through 2019 on five rivers in the state. These temperatures mostly track each other, as well as the average air temperature for the state. This is especially the case for the statewide average air temperature and Cedar River water temperature; their correspondence is striking. As one might have been expected, the water (and air) temperatures were greatest in 2015. What might not be remembered so vividly is how cold it was in the spring of 2011. We hasten to add that this is not a novel result in that Isaak et al. (2012) among others, have documented the large positive correlations between seasonal mean water and air temperatures.
 Figure 2: Mean spring (April-June) water temperatures for 5 rivers in Washington state during the years of 2005 and 2019. The seasonal mean air temperatures for the state are indicated with the solid black line. See text and legend for details.
We close with a thought about what this relationship portends for water temperatures in WA during future decades. It turns out that the long-term temperature trends in Washington include lesser increases in spring (and fall) than during winter and summer, as reported by Abatzoglou et al. (2014). This can be accounted for, at least in part, by seasonal differences in long- term changes in the large-scale atmospheric circulation, but anything close to a satisfactory treatment of that issue is well beyond the scope of the present piece. Suffice to say that as our climate continues to warm, our streams are along for the ride, with serious consequences for some native species. For more on the probable future of our rivers, readers are encouraged to check out the report published by the Climate Impacts Group of the UW, available at the following website: https://cig.uw.edu/datasets/washington-state-water-temperature-projections/
References
Abatzoglou, J. T., D. E. Rupp, and P. W. Mote (2014): Seasonal climate variability and change in the Pacific Northwest of the United States. J. Climate, 27, 2125–2142, doi:https://doi.org/10.1175/ JCLI-D-13-00218.1.
Isaak, D.J., S. Wollrab, D. Horan, and G. Chandler (2012): Climate change effects on stream and river temperatures across the northwest U.S. from 1980-2009 and implications for salmonid fishes. Climatic Change, 113, 499-524, doi:10.1007/ s10584-011-0326-z