By Nick Bond
Summers have been gradually getting warmer and more humid in WA state, with plenty of variability, but has that been accompanied by a tendency for more thunderstorms? We don’t get many thunderstorms compared to elsewhere in the US, especially east of the Continental Divide. In fact, Washington state experiences fewer lightning strikes per unit area than any of the other lower 48 states. But it would be reasonable to hypothesize that the warming and moistening would lead to an overall environment favoring reduced static stability and hence more thunderstorms. The summer of 2020 so far has been on the quiet side. That being said, there have been some more lively summers in recent years and so we felt it worthwhile to take a look.
We begin by simply counting the number of thunderstorm days at three lowland locations in WA, specifically SEA, YKM and GEG during the months of June through September for the years of 1990 through 2019 (Fig 1). The source of this information is NOAA’s Local Climatological Data report that is compiled for about 40 locations across the state. Perhaps a better way to quantify thunderstorm activity is through time series of lightning strikes, but this data is not easily accessible, and so here we will go with the thunderstorm days at the three spots representing the western, central and eastern portions of WA state. Not surprisingly, Spokane is the big winner with an average of 7.4 thunderstorm days a summer, with Yakima and Seattle checking in with 3 and 2.5 days, respectively. With respect to overall trends, 30 years is a short interval, especially for this kind of potentially climate-related variable that is inherently noisy. At any rate, counts of thunderstorm days tended to be greater in Spokane in the first few years of the record considered here; no systematic changes are apparent for Yakima and Seattle. In terms of the correspondence between year-to-year variations at the three locations, the linear correlation coefficients between the thunderstorm days at Seattle with the thunderstorm days at Yakima and Spokane are 0.36 and 0.37, respectively. The two stations east of the Cascade crest have a substantially greater correlation coefficient of 0.64.
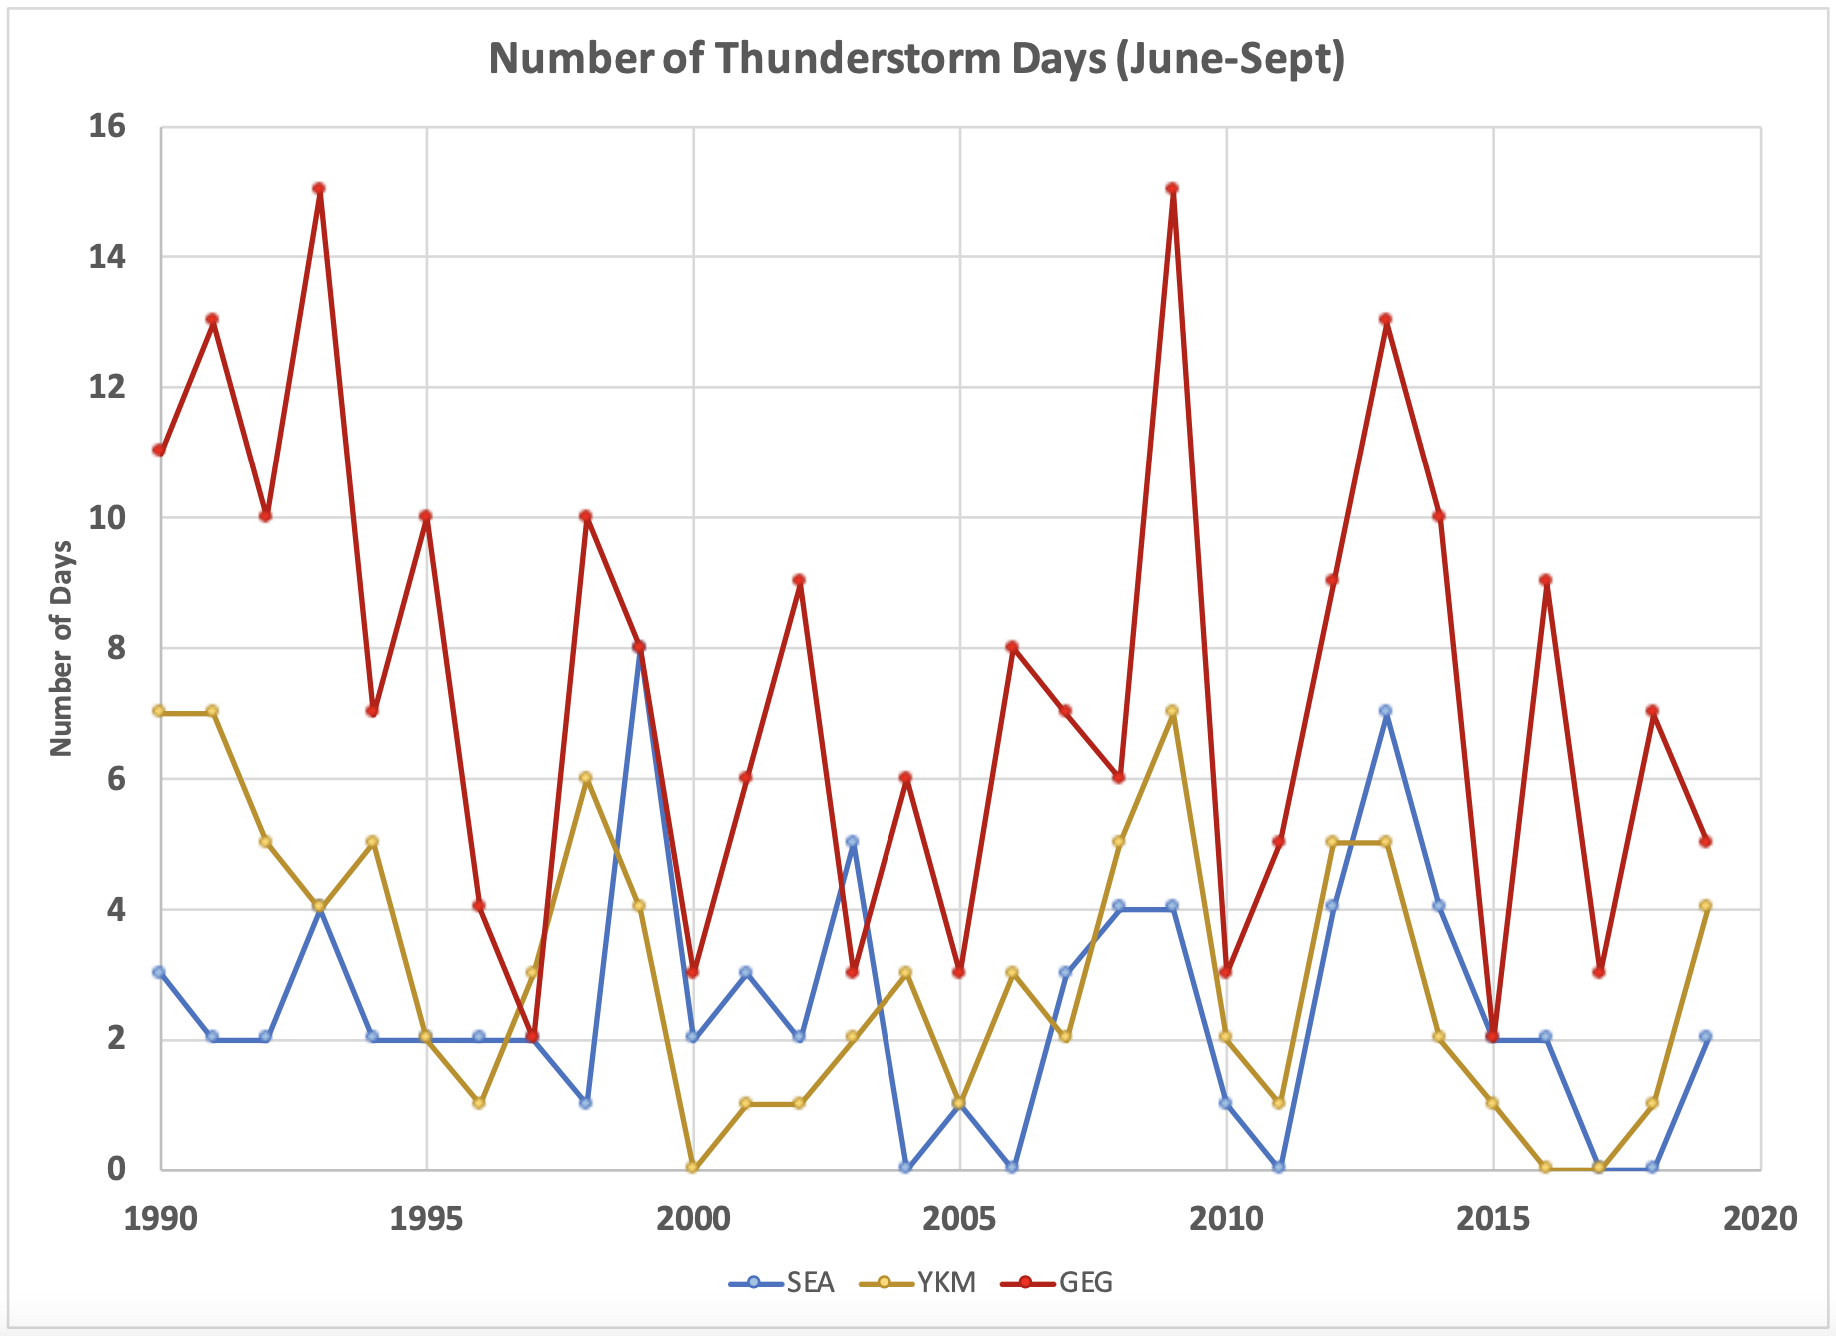 Figure 1: Thunderstorm days during June through September in Seattle (KSEA; blue trace), in Yakima (KYKM; gold trace) and Spokane (KGEG; red trace) for the years of 1990-2019.
Now, let us direct our attention to the overall environment for deep convection in WA state over the last 30 years. We do this here in an admittedly crude way by simply showing summer averages of near-surface and of upper tropospheric properties for an area encompassing WA state. More specifically, using the NCEP Reanalysis data set, we have formed time series for the wet-bulb temperature at 925 hPa (typically about 750 meters above sea level) and air temperature at 300 hPa, which is near the tropopause, as plotted in Figure 2. The 925 hPa wet bulb temperature is dependent on both the air temperature and humidity, and is directly related to the air temperature of a parcel that is lifted from that level to saturation. For present purposes, tatic stability is dependent on the difference between the 925 hPa wet bulb temperature and the 300 hPa air temperature. The higher the 925 hPa wet bulb temperature and the lower the 300 hPa air temperature, the lesser the overall static stability, and all other factors being equal, the more favorable for thunderstorms. It bears emphasizing that the aforementioned omitted factors, in particular related to the regional circulation, are absolutely key for thunderstorms to occur, so a lot here is being swept under the rug.
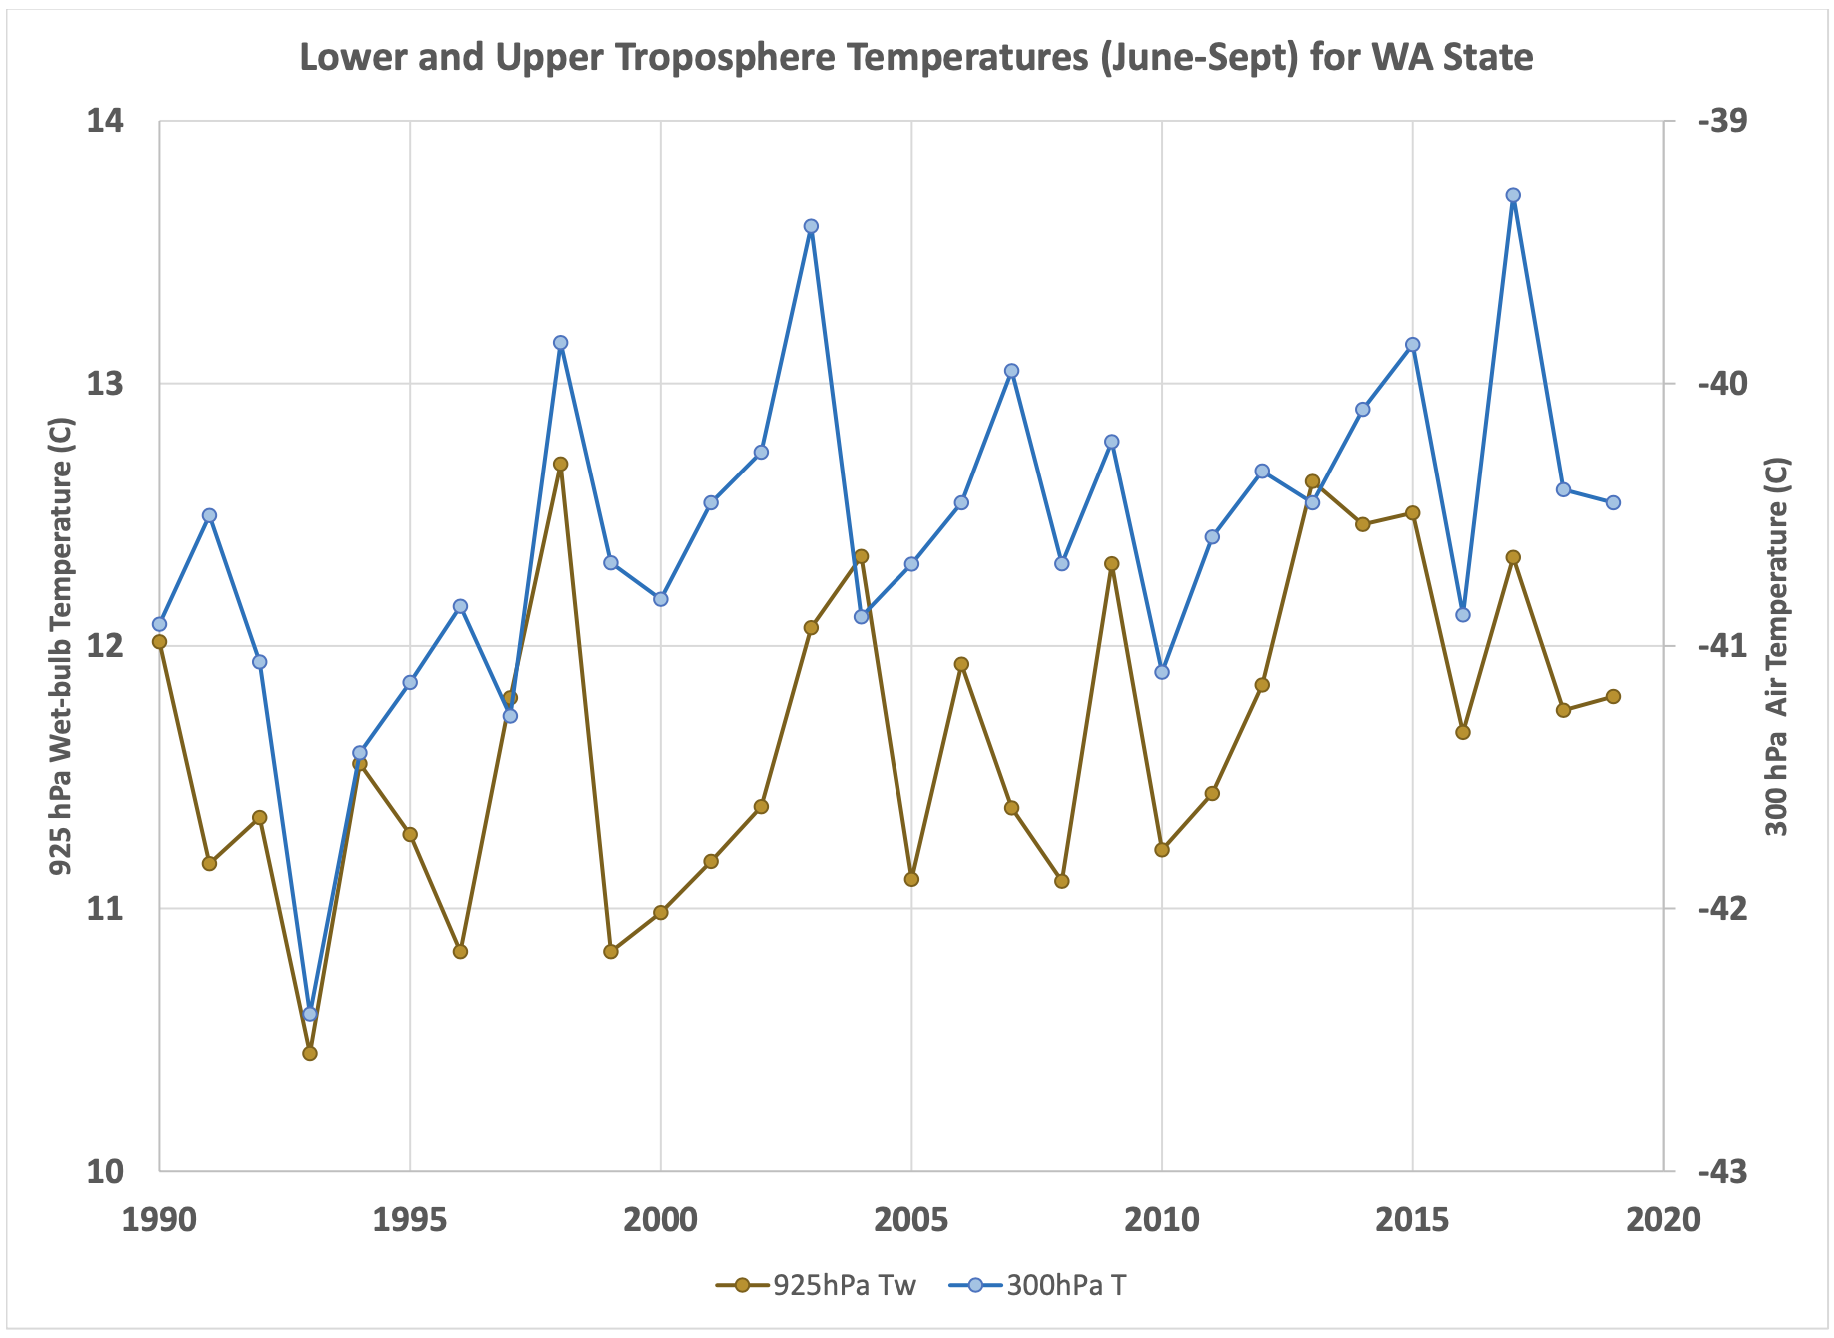 Figure 2: Mean summer (June-September) 925 hPa wet-bulb temperatures (brown; scale at left) and 300 hPa air temperatures (blue; scale at right) over the region of 45-50 N, 125-117.5 W for 1990-2019 from the NCEP Reanalysis.
Forging ahead, we note the general tendency for increases in both the 925 hPa wet-bulb and 300 hPa air temperatures. Importantly, the difference between them is not changing to any noticeable extent, and by inference, the thermodynamic environment for thunderstorms as indexed by our measure of the moist static stability. This is actually an expected result. Frierson (2006) showed that climate model simulations of global warming in the midlatitudes indicate a robust signal of upper tropospheric warming and little change in the moist static stability. Frierson focused on zonal mean properties; it appears that the atmosphere’s tendency to maintain a quasi- equilibrium state even applies on relatively small spatial scales such as WA state at least after averaging over the year to year variations. The variations in the two temperatures, and their difference representing static stability, are considerable (Fig. 2). It turns out that none of these variables correspond with the number of thunderstorm days in Seattle (correlation coefficients are < 0.1). On the other hand, there is a linkage for Yakima and Spokane, with the temperature difference being a better predictor of the number of thunderstorm days than either of the two individual temperatures. One implication of this result is that if we could predict the moist static stability for eastern WA in summer on seasonal time scales – which is a big “if” – we would also have a heads-up on probable thunderstorm activity and perhaps an important element of the risk of wildfires.
Reference:
Frierson, D., (2006): Robust increases in midlatitude static stability in simulations of global warming. Geophys. Res. Lett. 33(24), doi:10.1029/2006GL027504.