By Nick Bond
The term “polar vortex” has been in the news recently, prompting this piece on the connection of the Arctic Oscillation (AO) to the weather of WA. In early January 2021, some attention was given to the polar vortex and the relationship to the sudden stratospheric warming that occurred near the pole (AO+). Those events tend to be followed by a weaker and less symmetric polar vortex, implying a negative state for the Arctic Oscillation (AO-).
When the AO is positive the polar vortex is strong and symmetric with the coldest air essentially bottled up near the North Pole. When the AO is negative, the high latitude circulation includes much more prominent ridges and troughs, with this pattern tending to deliver especially cold air to the mid-latitudes. This delivery occurs in preferred locations, e.g., eastern Asia and northern Europe, but there is considerable variability. Previous work (e.g., Wettstein and Mearns 2002) has documented how the AO relates to the mean and variability in wintertime temperatures in particular locations. Naturally, we are taking on the subject with a focus on WA. We build on a previous piece in this newsletter (Jan 2014 edition), which illustrated the results from some research by Prof. Wallace and his student Greg Ostermeier, which documented the incidence of days of extreme minimum temperatures and precipitation amount vis-a-vis the AO. Our specific interest here is to describe what has happened during past winter months with strongly negative or positive AO values, and in particular how those two sets of months have played out in terms of their means and standard deviations in temperature and precipitation on monthly time scales, and whether they exhibit different magnitudes of day-to-day variability in temperature.
Our analysis considers the years of 1970 through 2020. Our focus is on the 15 winter (DJF) months with the greatest negative values for the AO and the 15 months with the greatest positive values. The tacit assumption is that if there is a signal associated with the AO, it will emerge in comparison of periods when it is strongly positive versus strongly negative. We use the compiled state mean temperature and precipitation anomalies for these months from NOAA’s Climate at a Glance. Towards describing the day-to-day variability, we calculated the standard deviation in daily average temperatures from Sea-Tac, Spokane and the Tri-Cities for each of the extreme AO months.
We begin with a map showing the correlation between the 500 hPa geopotential height (Z) and AO during the months of December through February (Fig. 1). Positive values over North Pacific and lower values over Alaska and western Canada imply that positive AO periods tend to be accompanied by enhanced flow aloft from the west-northwest. Similarly, negative AO periods tend to be accompanied by suppressed flow aloft from the west-northwest. A similar map showing the correlation between atmospheric boundary layer temperatures and the AO reveals that positive AO periods tend to include slightly lower than normal temperatures over WA (not shown). But this type of analysis cannot be used to surmise much about the variability, which is why we wanted to dig into the station measurements of temperature and precipitation during the two phases of the AO.
The results from our analysis are summarized in Tables 1-3. Tables 1 and 2 itemize the mean statewide temperature and precipitation anomalies during the AO- and AO+ months, respectively. We were struck by the similarity in the two sets of months. They had nearly identical negative temperature anomalies in an overall sense, with somewhat greater month to month variability among the negative AO months. In terms of precipitation, there has been somewhat greater average negative anomalies, and greater variability, during AO- periods but the differences are modest at best. We included the value of the NINO3.4 index for the months in each set, out of curiosity whether ENSO might help account for the results. It turns out that AO- conditions are favored to an extent during El Niño, due to greater “wave activity” emanating from lower latitudes essentially disrupting the polar vortex. The two sets of months both included a range of NINO3.4 values; both La Niña and El Niño are represented in each set. Conceivably the slight overall difference of a weak tendency for a warm tropical Pacific during the AO- months, and for a cool tropical Pacific during the AO+ months helps damp the direct effects of the AO on the weather of WA. But a quantitative attribution is way outside the scope of the present piece – and given the weakness of the signal seems hardly worth the trouble. Finally, our results based on the daily data for three locations in WA also show that the AO apparently has little effect on the day-to-day variability in temperatures, in an overall sense. There was somewhat greater variability in the temperatures in the Tri-Cities during the positive AO months, which is actually the opposite of what was expected.
We are unsure if there is a moral to this story. Perhaps it suffices to say that the residents of WA should not quake in fear when the weather community begins chattering about the present and future state of the polar vortex, at least from a local yokel perspective.
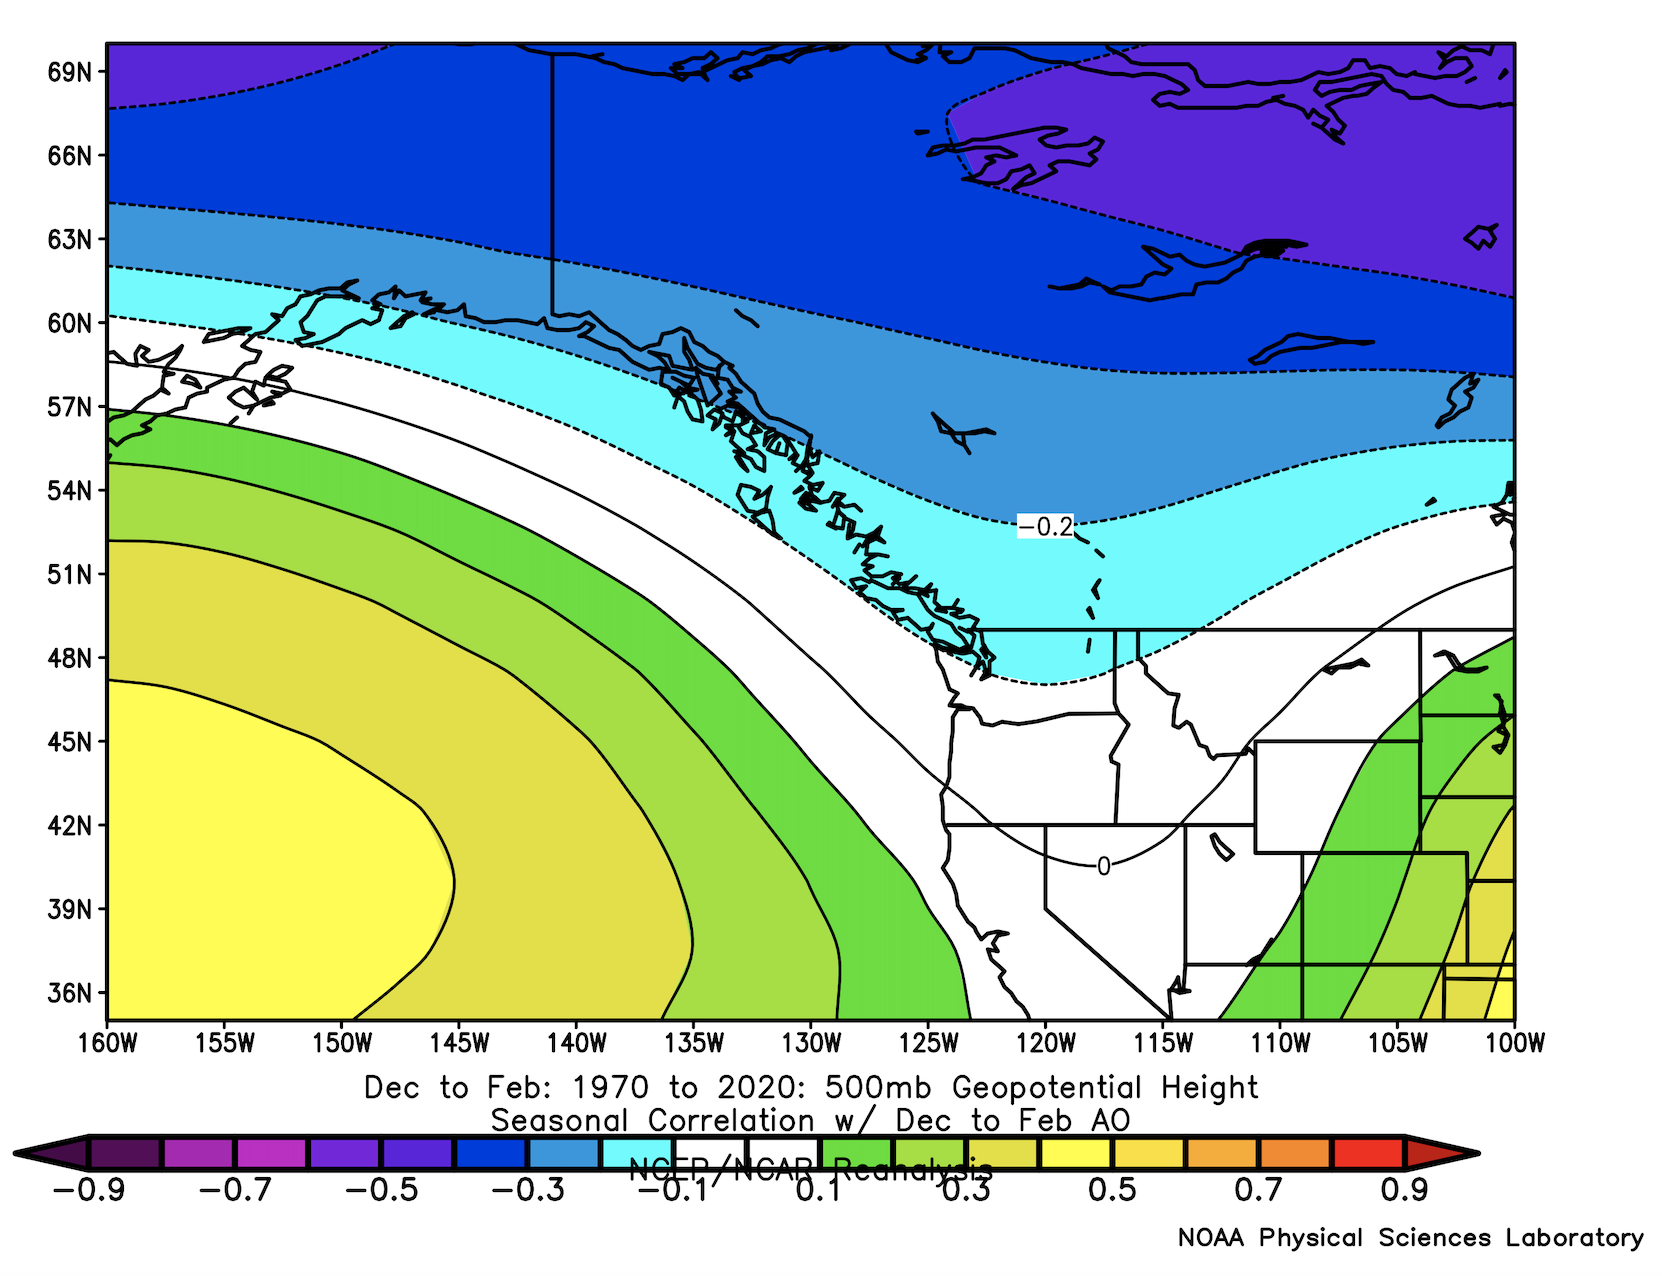 Figure 1: Model reanalysis of the correlation of 500 hPa geopotential height with the Arctic Oscillation (ESRL).
Reference:
Wettstein, J.J. and L.O. Mearns (2002): The Influence of the North Atlantic-Arctic Oscillation on Mean, Variance, and Extremes of Temperature in the Northeastern United States and Canada. J. Climate, 15, 3586-3600.