By Karin Bumbaco
OWSC is pleased to release a new web tool that displays the bi-monthly snow depth data from the Northwest Avalanche Center (NWAC). Partially supported by Tableau, this was a collaboration between NWAC and OWSC and was recently featured in a UW News piece.
For years, NWAC has provided a text product (known as CLISNO), which shows the snow depth at 11 stations (9 in Washington and 2 in Oregon) two times a month from November 15 through May 1. Note that this is snow depth (i.e., the measurement of the depth of the snow on the ground) and not snow water equivalent (i.e., the amount of liquid in the snow if all the snow is melted). Regardless, snow depth behaves similarly, in that it builds throughout the season with a peak usually in April. One benefit of viewing the snow depth at the NWAC (and partners) stations is that these stations are located where people actually go to recreate, as opposed to the more remote SNOTEL sites where most of our snow water equivalent information comes from. The new tool displays these snow depth measurements graphically in a few different ways. The “Station View” shows the complete Nov 15- May 1 season for one particular station along with a user-selected range of historical seasons. The “Seasonal View” also shows the data in a complete season, but for only one season and for all 11 stations. The “Single Date View” is a bit different, and allows the user to see the historical variability for one station on a specific date. Let’s look at some examples.
As most of our readers are likely aware, the current winter has included a moderately strong La Niña in the tropical Pacific. The last La Niña of comparable intensity, with SST anomalies more than 1°C below normal, was during the winter of 2011-12. The WA snowpack actually got off to a slow start during that winter but ended the season much above normal. Mt. Baker (Figure 1), with snow depth records back to 1927, shows that 4/1/2012 had the 6th greatest 4/1 snow depth with 267” (154% of normal). Interestingly, the 2/15/2021 snow depth observations are greater than the 2/15/2012 observations for all 11 stations (Figure 2). This does not mean we’re guaranteed to rival the impressive snow depth of 2012 by April, but given that the seasonal forecast indicates cooler and wetter than normal conditions for the spring, we have a fair shot. The latest 3/1 observations show above normal snow depth for all 11 stations (between 109 to 167% of normal).
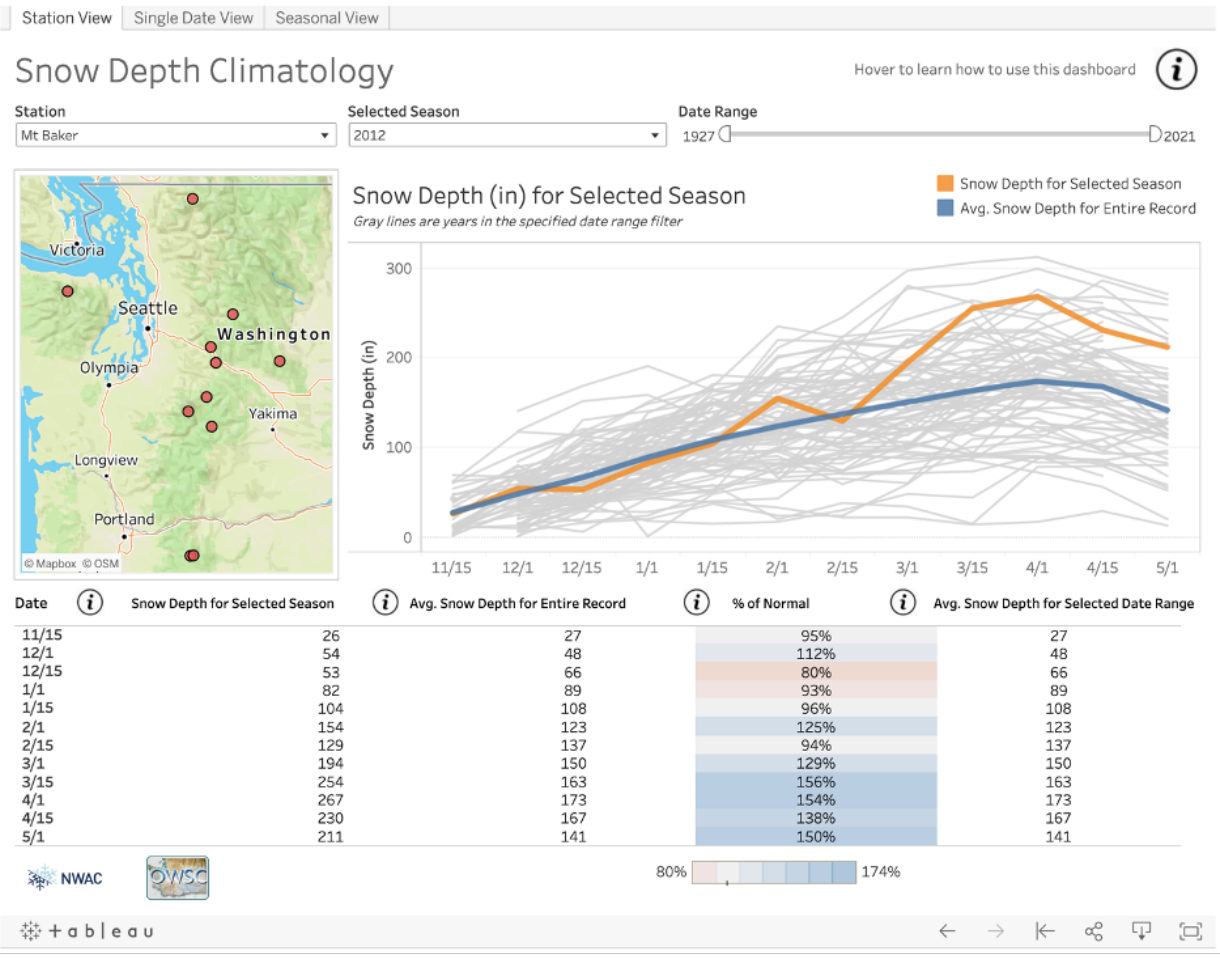 Figure 1: Snow depth on Mt. Baker from the 2011-12 winter season (orange line) compared to average (blue line) and historical seasons (gray lines) dating back to 1927. This display is from “Station View” tab.
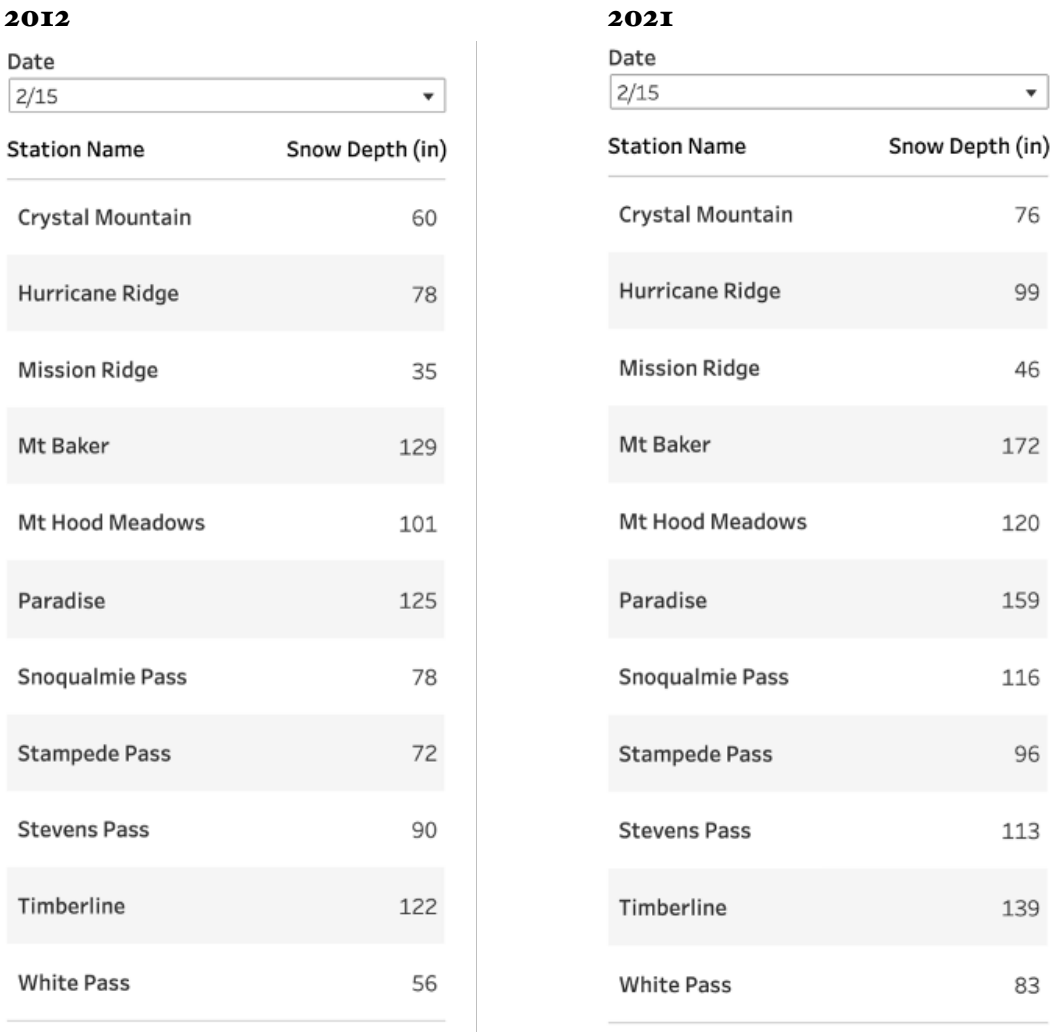 Figure 2: The snow depth values on 2/15/2012 (left) and 2/15/2021 (right). These images were pulled from the “Seasonal View” tab.
Historical snow depth measurements on 3/1 are shown for Paradise using the “Single Date View” tab (Figure 3). The 3/1/2021 measurement of 221” ranks as the 7th greatest in the 95-year record. There are some missing data (1949, 1950, and 1952), and we know that those were rather snowy years, so the ranking of 7th greatest may be a bit inflated. In addition to the record high seasons, the low snow depth measurements jump out on this graph as well. The March 1 snow depth measurements in 1977, 2005, and 2015 of only 67”, 43”, and 69”, respectively, are indicative of major drought years in WA history. The point here is that this is a tool that can be used to examine extremes on both sides.
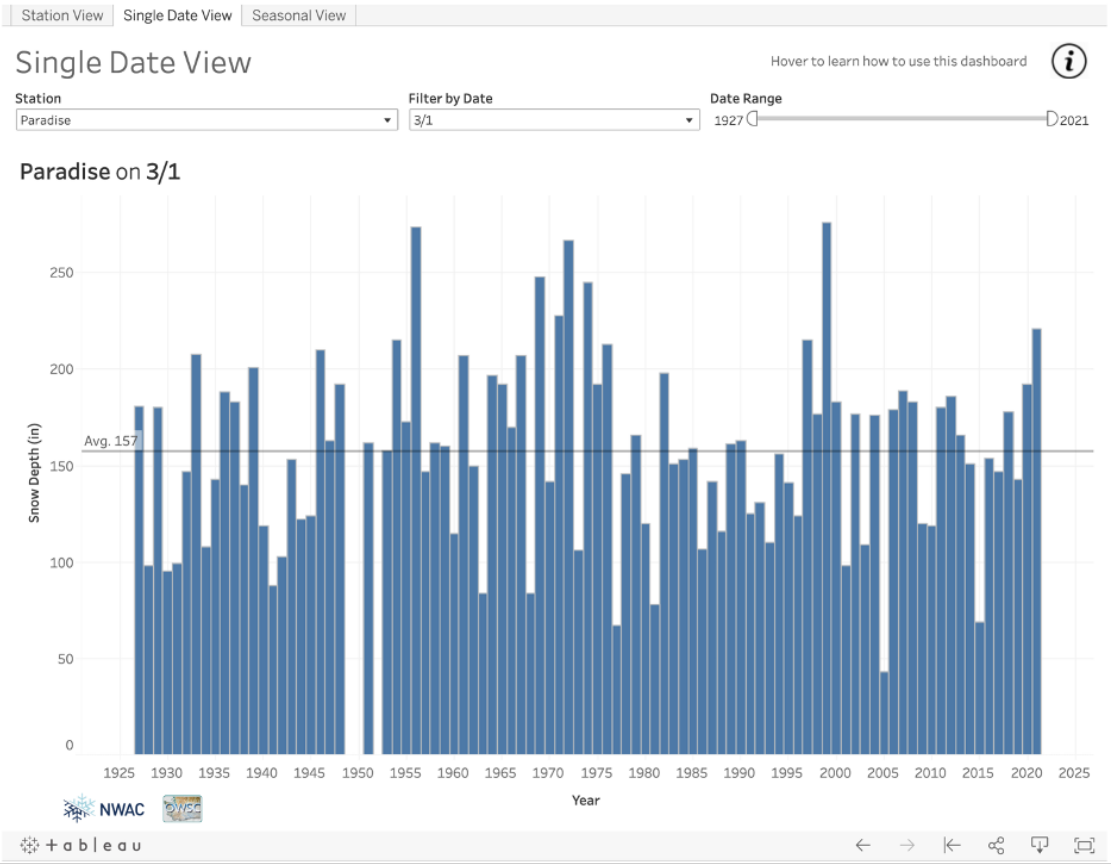 Figure 3: March 1 snow depth measurements for the 95-year record at Paradise using the “Single Date View” tab. There are some missing data in the early 1950s.
Future work on this visualization will involve adding the ability to parse out seasons depending on their La Niña or El Niño classification and potentially adding a few more stations. We are open to other suggestions and feedback on the tool. In the meantime, enjoy digging into this historical data!