By Nick Bond
Readers of this newsletter may recall the piece in the January 2021 edition featuring a link to a survey aimed at determining the location in Washington state with the best climate. Our idea was to follow-up on an effort by Jan Null (Certified Consulting Meteorologist, Golden Gate Weather Services) to score U.S. locations based on an “ideal” climate, i.e., the so-called Camelot Climate Index. His scheme favored locations with mild temperatures, little precipitation and relatively few extremes, acknowledging those are not everyone’s preferences. We thought it would be interesting to see both what kind of weather that a larger group of people prefer, and how different parts of the state stack up with these preferences in mind. Our survey had 183 entries. We requested that entrants indicate their county of residence, and the vast majority of the responses were from Pierce, King or Snohomish counties. This was no great surprise in that the participation must have swelled substantially by the announcement of the survey on the popular weather blog maintained by Scott Sistek (formerly of KOMO and now with FOX Weather and Q13 FOX), and his audience is presumably largely drawn from the Puget Sound metro area. Only about 10 entries were from residents of counties east of the Cascade crest; more about that later.
The survey included solicitation of a name for our ideal climate index, and we appreciate all the contributions. Special recognition goes to the tortured acronym represented by the “Calculation Of Feelings From Environmental Elements (COFFEE)” index. Also of note are the two ends of the spectrum reflected by “Sucks most gloomy depressing place on Earth”, and “Winters Bliss and Summer Delight”. I want what the latter participant has for breakfast. The first runner-up for the name, with 4 entries, is “Evergreen Index”. The top honor goes to Goldilocks, which was included in some form in 8 separate entries. The official name will be the Goldilocks Climate Index.
We begin with the results from the survey in terms of the preferred value for each of the 11 categories as summarized in Table 1. Included for each weather element are a measure of the spread in the responses, and their relative rank of importance. There are a variety of takeaways from these results. First, folks care most about summer mean high temperatures, and prefer them on the moderate side, with a median of 77°F. Similarly, there are also not many hot day fans (pun intended), with the number of 90+ F days ranked 2nd in importance and coming in with a median of only 2. Not many care much about how windy it is in summer, which is no real surprise. But the second and tied for third least important categories were the number of days per year of measurable (>0.01”) and significant (>0.25”) precipitation, respectively, and that result is unexpected. Certainly there is plenty of grousing by the general public during the stretches of wet weather that can prevail on the west side of the Cascades. On the other hand, perhaps the people that filled out our survey are cut from a different cloth. Consistent with this supposition are the results for the category of number of cloudy days per year, which tied for 3rd least important, and mean (median) values of 170 (157) days, which we suppose are substantially greater than for the populace as a whole. Also interesting are the results for the winter weather categories. There appears to be a fair amount of tolerance for cold temperatures and snow; we note the large spread in the responses in the latter category. This makes sense given the widely divergent feelings about snowstorms. At least in the Puget Sound lowlands, after even minor snowstorms you don’t have to go into work, but after major snowstorms you can’t get to the liquor store!
 Table 1: The ranking of categories by importance and mean, median, and standard deviation of the selections made by the 183 survey participants.
Given the survey choices summarized above, we now turn our attention to ranking the overall climate of 15 locations across Washington state; the climate averages for each are shown in Table 2. Our scoring system is like golf rather than bowling; the lower the number the better. Without further ado, we now can state that the location with the best climate – drum roll please – is Sea-Tac Airport (Figure 1). Bellingham ended up second with Olympia and Vancouver not far behind, based on the medians of the choices in each category. We are unsure of what to make of the results. Conceivably it merely reflects that most of the entries were from the Puget Sound lowlands, and folks have gotten accustomed well enough to its weather to consider it ideal. But the coastal locations of Hoquiam and Quillayute ended up with scores in the middle of the pack and that is kind of suspicious. One cannot help but wonder if transplanted to the coast, how well most individuals would cope with its frequent deluges. The locations in eastern Washington seemingly have considerably less favorable climates. Because of its cold and snowy winters, Winthrop has the dubious distinction of tying for last place. Due to the outsized influence of this newsletter, the residents of the Methow Valley may be looking at a nosedive in property values. The dry spots of Omak, Yakima and the Tri-Cities did not fare much better. Pullman took top honors on the east side of the state, and hence somebody knew what they were doing in locating WSU. Note that the relative ranking of the climate of the Seattle area and Pullman mirrors their schools’ records in the Apple Cup, so there is that. A spot check of individual survey entries from east of the Cascades reveals a taste for warmer summers, colder winters and lesser precipitation relative to those for the entrants as a whole. So again, is this a case of people choosing the weather they experience over the weather they actually favor? We can only speculate, of course. We conclude with a big thank-you to everyone who took the trouble to fill out the survey, and we hope all those that participated enjoy seeing how it all turned out.
 Table 2: The 1991-2020 climate averages for the 15 locations scored. The average period used for the summer wind speed (1996-2006), number of cloudy days (1973-2000), and annual snowfall (either 1981-2010 or 1991-2020, depending on the station) differed from the rest of the categories.
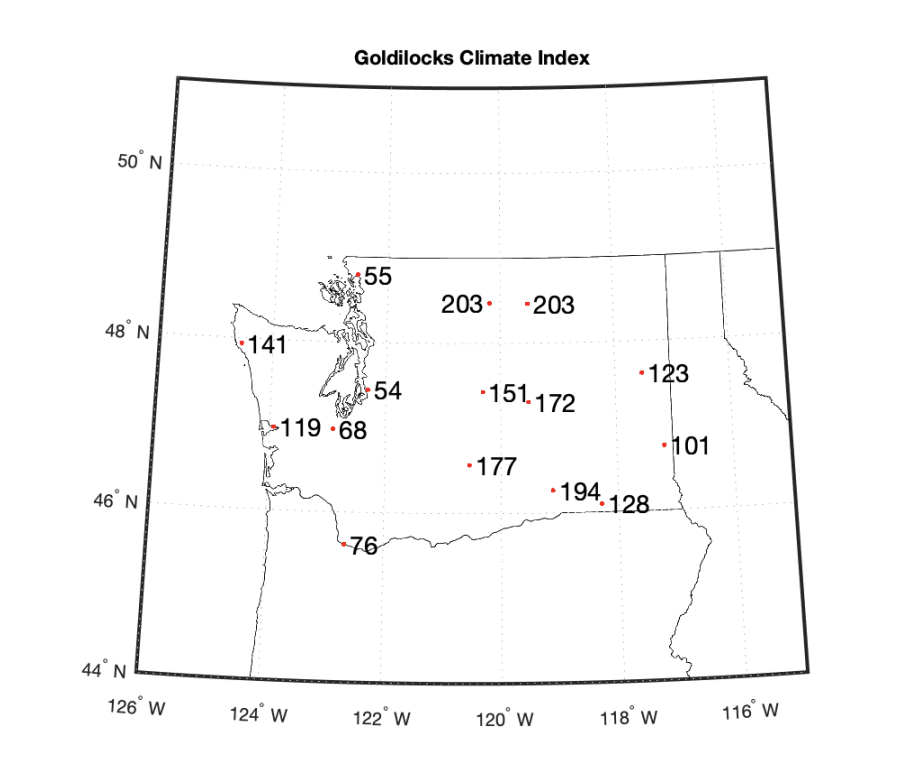 Figure 1: The Goldilocks Climate Index for 15 locations in WA with scores based on the median preferences of 183 survey respondents. The lower the score the more ideal the climate is.