By Haley Staudmyer
This is the third installment of the “Climate Divisions of WA” series, in which we discuss Climate Division 3 – the Puget Sound Lowlands Climate Division. For analyses of Climate Divisions 1 and 2, see the August 2018 and August 2019 editions of our newsletter. As seen in Figure 1, the division encompasses most areas coastal to the Puget Sound, including the major cities of Olympia, Tacoma, Seattle, and Bellingham and encompassing most of the population of WA State. Most of the division is nestled between the Olympics and the Cascades. True to its name, elevation rarely breaches 1000’ in the Puget Sound Lowlands, but the borders of the division that include the northeast side of the Olympic Mountains see higher elevations up to between 4,000 and 5,000 ft.
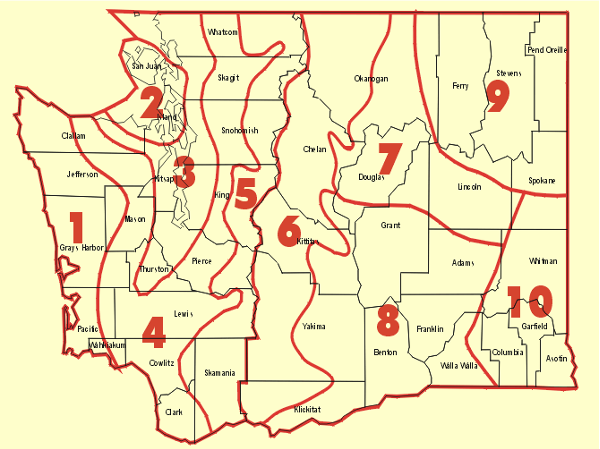 Figure 1: Map of all the WA State Climate Division from the Climate Prediction Center.
Figure 2 illustrates the monthly total precipitation, as well as the maximum and minimum temperatures averaged over the division for 1991-2020. Though many perceive Seattle to be one of the rainiest cities in the country, average annual precipitation for this climate division totals at 45”, which is less than half of that of Climate Division 1. That being said, cities within Climate Division 3 regularly see more than 150 days with precipitation each year, most of which occur between October and April when the lowlands are subject to more of a pervasive gloom rather than intense deluges. During the long rainy season, the westerlies and the jet stream provide a frequent source of moist air and low-pressure systems that flow around and over the surrounding topographical features, often producing large sheets of stratiform clouds and small-droplet precipitation. One may notice February is drier than March on average during this time period; there is no particular climatological explanation for this other than the fact that this division has happened to experience some rather dry February months and rather wet March months over the past twenty years. The central portion of Climate Division 3 can sometimes be rainshadowed by the Olympic Mountains if the flow from an incoming storm is westerly. This feature results in Seattle actually receiving considerably less annual precipitation (39.34”) than many southern locations within the division (such as Olympia: 50.62”), where the Olympic Mountains tend to have less of an impact.
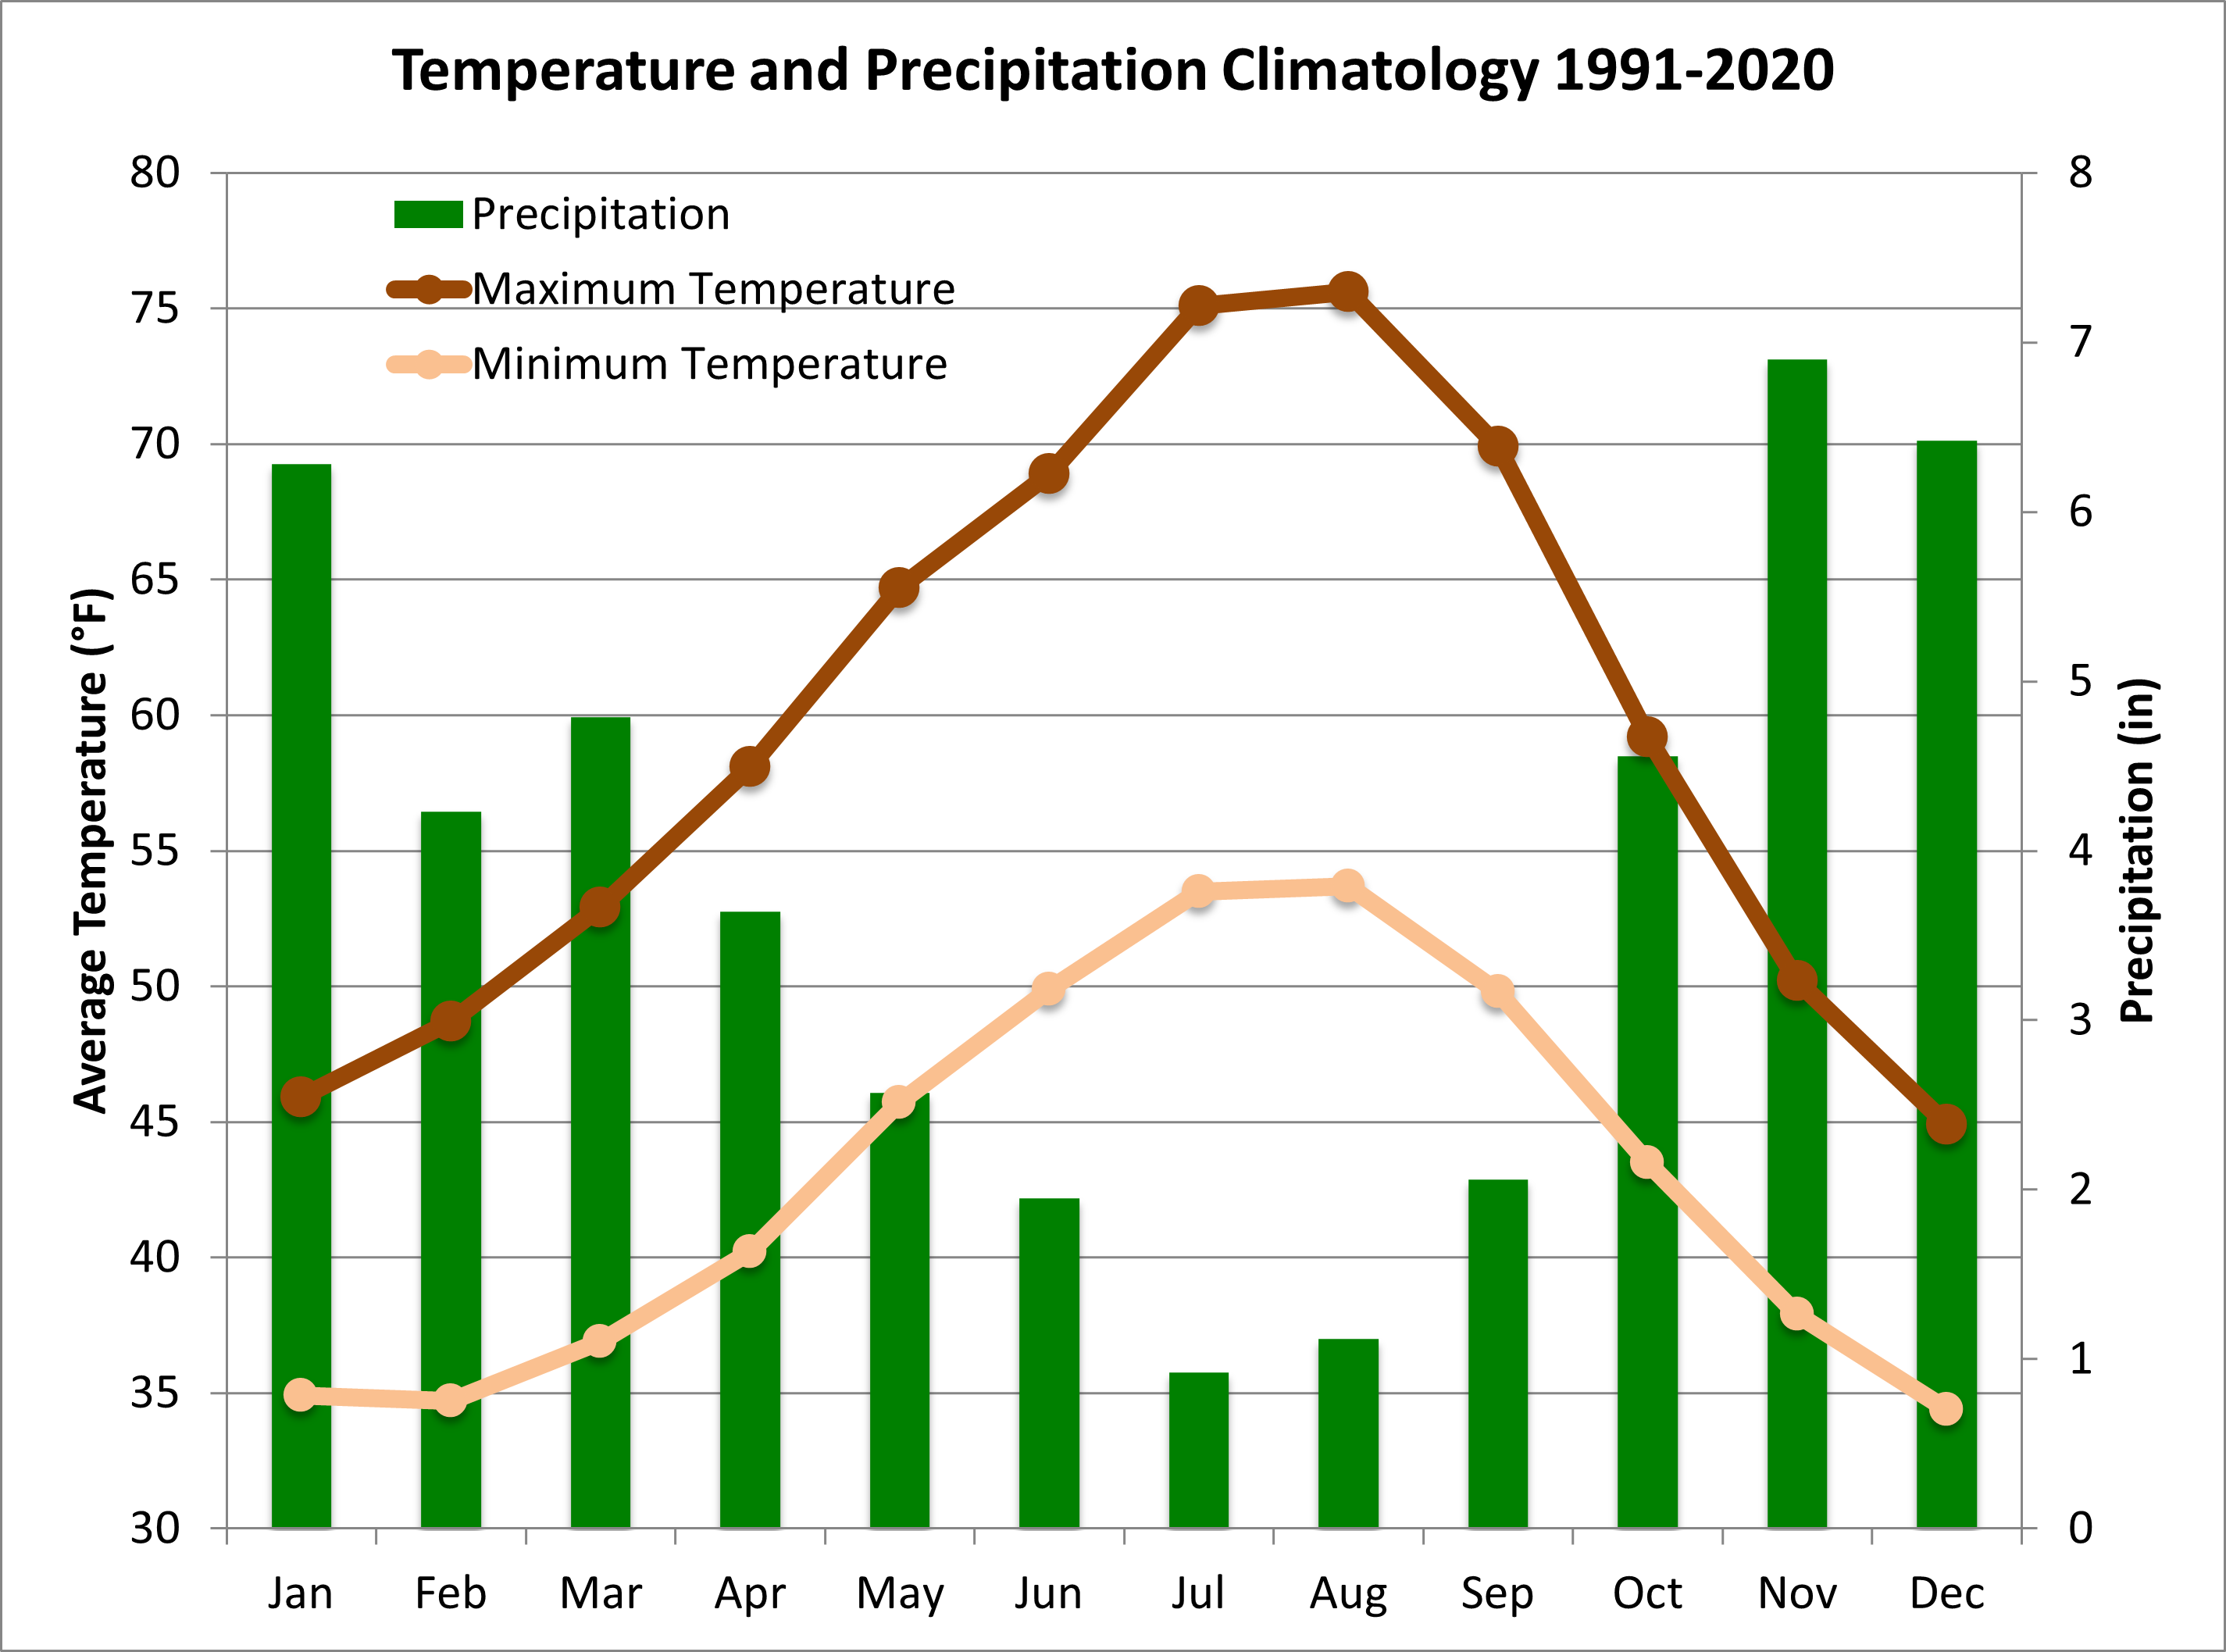 Figure 2: Monthly maximum temperature (°F), minimum temperature (°F), and total precipitation (inches) for the 1991-2020 period for Climate Division 3.
Keeping in line with the rest of the state, temperatures in this division are, on average, warmest in August and lowest in December. Proximity to water keeps temperatures fairly moderate throughout the year. The average minimum temperature in December remains above freezing at 34.4°F, while the average maximum temperature in August tops out at a comfortable 75.6°F. At least most natives of the region will tell you the gloom of the long winter is worth it for the beautiful, temperate summer. Readers of this newsletter will recall that the Goldilocks Climate Index of last month’s issue found that the three cities with the “best” climatology in the state reside in Climate Division 3. The typically moderate summer temperatures are also why the majority of homes and apartments in the area are without air conditioning – which is all well and good unless a heat wave passes through.
Table 1 shows the warmest, coldest, wettest, and driest months in Climate Division 3 since the record began in 1895. The results look familiar – the records for the warmest, coldest, and driest months go to July 1958, January 1950, and July 1922, respectively, and are the same among all three climate divisions the OWSC has reported on thus far. The wettest month on record for Climate Division 3, December 1933, is also one of the two instances that tied for the wettest month on record in Climate Division 1 (though Division 1 saw twice as big of an anomaly). Regional weather patterns capable of producing monthly extremes are usually on a much larger spatial scale than that of a single climate division.
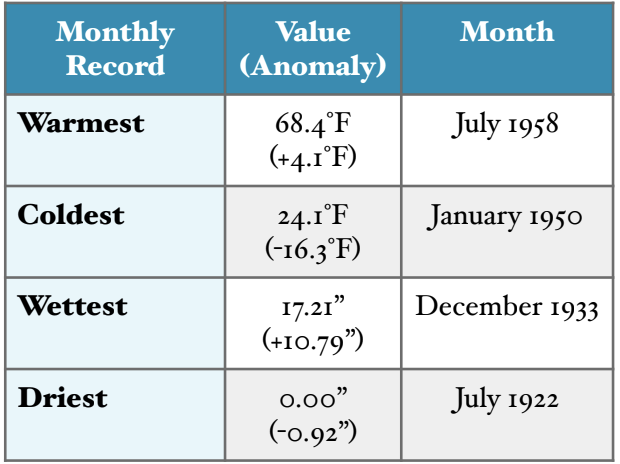 Table 1: The warmest, coldest, wettest, and driest month for Climate Division 3 using the period of record (1895-2021). The anomaly is relative to the 1991-2020 normal.
Figure 3 shows seasonal wind rose charts for Seattle Tacoma International Airport as an example of the wind climatology for the climate division. This single location is not representative of the wind climatology of all parts of the climate division, but it is a useful example. Compared to Climate Divisions 1 and 2, the Puget Sound Lowlands experience much less seasonal variations in wind strength and direction. Winds are southerly or southwesterly, more often than not, but northerly winds are also frequent, especially during the summer. The regional terrain generally channels the winds, with winds out of the west being particularly uncommon. Strong winds are considerably more frequent during the cool part of the year relative to summer. Diurnal effects are more prominent in the summer, during which wind speeds often strengthen in the late afternoon as a result of a combination of the effects of a sea breeze off the Puget Sound and a mountain-valley circulation associated with the west slopes of the Cascade Mountains.
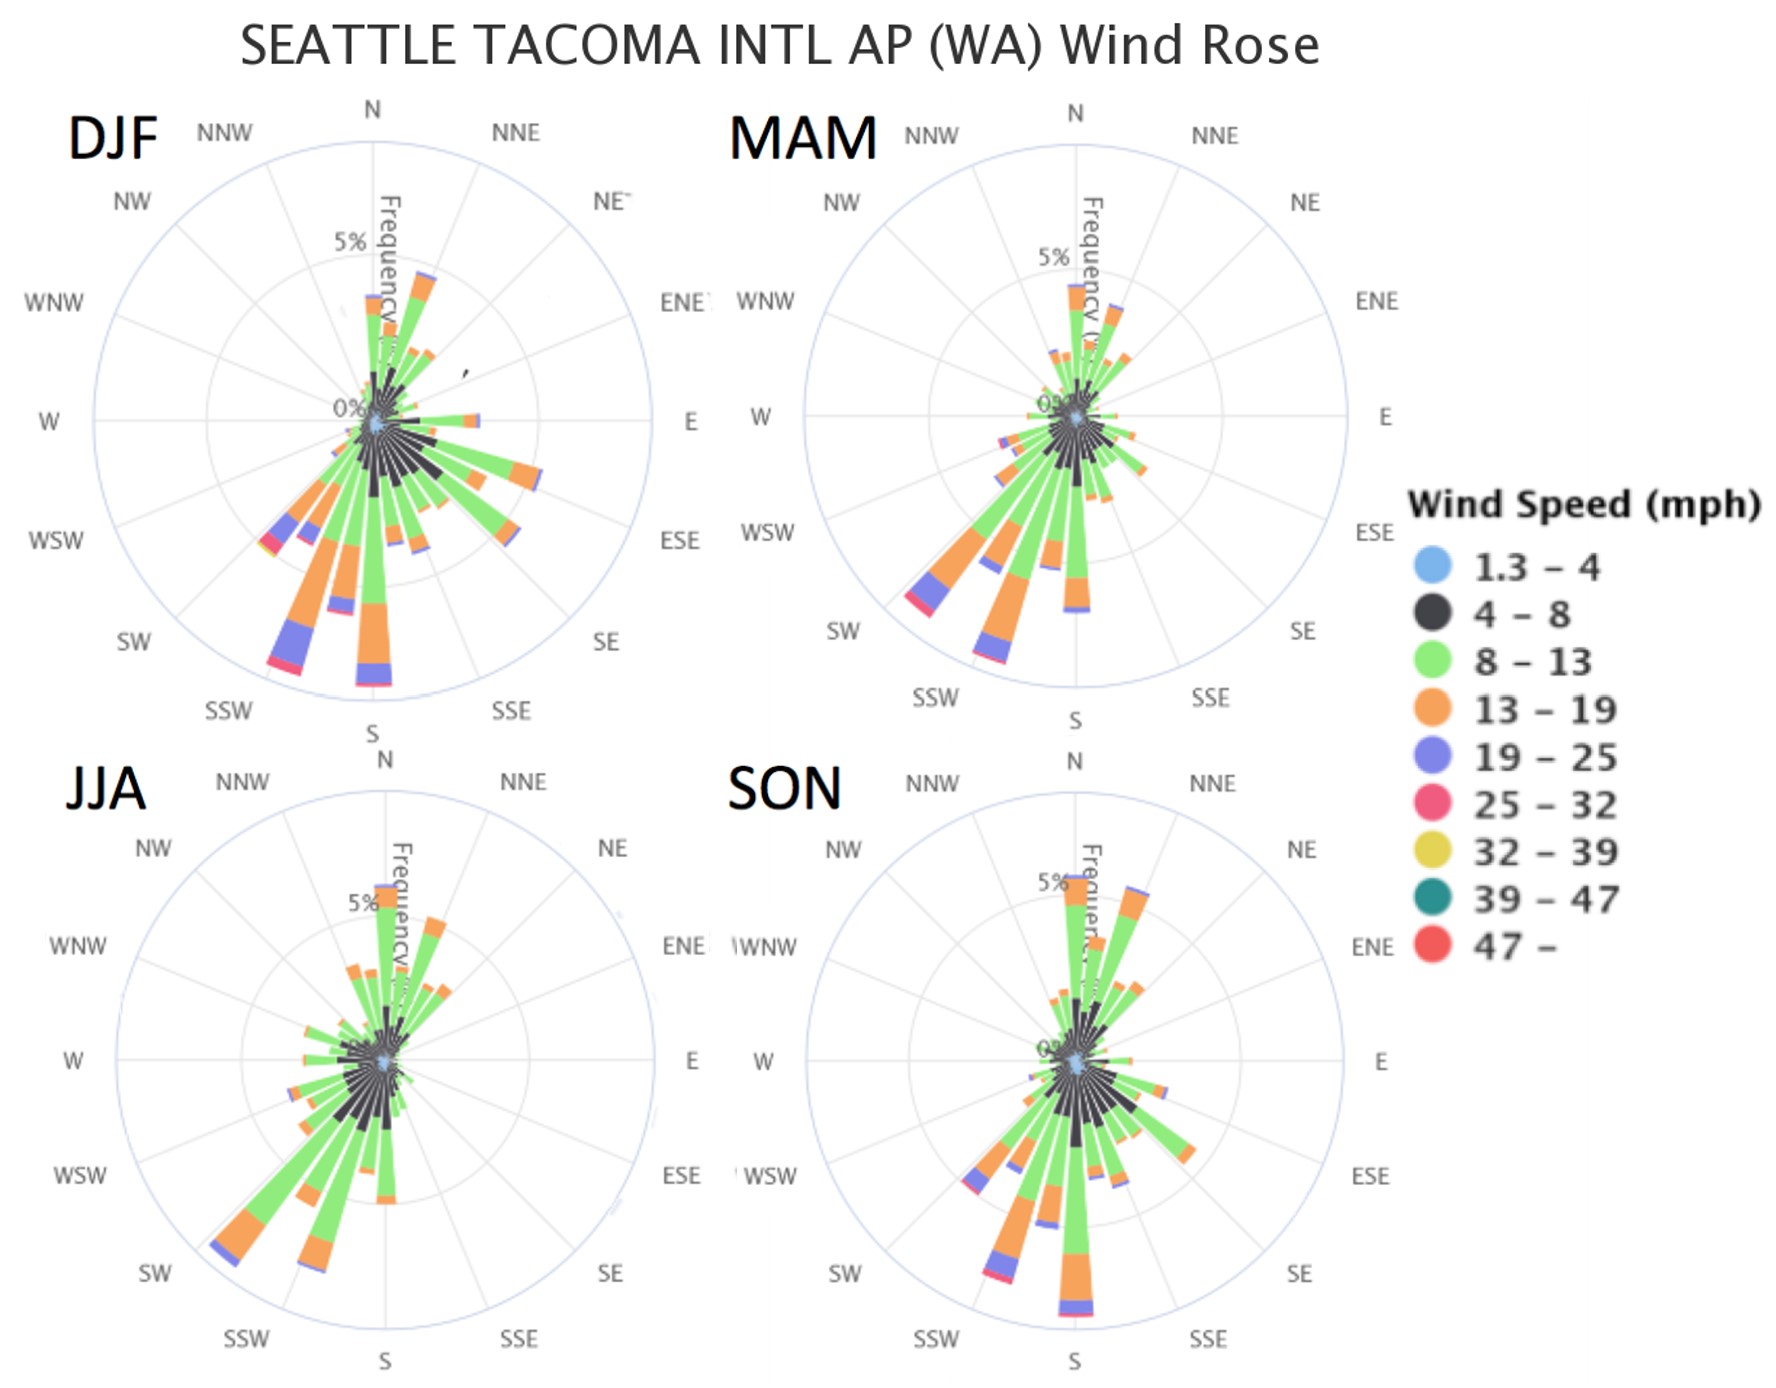 Figure 3: SeaTac Airport seasonal (Dec-Feb, Mar-May, Jun-Aug, and Sep-Nov) winds for the period of record (1945-2021) from MRCC’s cli-MATE.
To summarize, the Puget Sound Lowlands boast of a pleasantly moderate climatology. The local topography plays a large role in shaping prevailing weather patterns. Westerly winds arriving from the Pacific bring plenty of moist air to fuel a long wet season of light rain. Proximity to the coast means the division experiences a muted annual cycle in temperatures; the region is not accustomed to bitter cold nor extreme heat. Do you have feedback on our Climate Division Series? Email us, Tweet at us, or connect with us on Facebook.