By Nick Bond
Daily temperature and precipitation data are available going back many years, and are generally used to summarize the variability in the climate, including long-term trends. There are other aspects of the weather and climate that are interesting and important, however, but are often more difficult to procure and are not widely disseminated. Here we consider the frequency of strong winds in three locations, based on hourly data, for the period of 1981 through 2020, using the slick app provided by the Midwestern Regional Climate Center. In particular, we have counted the number of hours per month for which the mean wind speed, and separately, the gust wind speed exceeded prescribed thresholds at Hoquiam (KHQM), SeaTac (KSEA), Tri-Cities (KPSC), and Spokane (KGEG). The results of this exercise are summarized below.
For starters, we consider the seasonality in the occurrence of strong winds, as gauged by the total number of hours of gust speeds exceeding 39 MPH during each month over the 40 years of 1981 through 2020. The results are plotted in Figure 1. It should come as absolutely no surprise that Hoquiam has the highest overall total, due to the storminess of the coastal zone from October through March. As a bit of an aside, Quillayute (KUIL) near the northwest corner of the state had far fewer (about one-fifth as many) hours with gust speeds of this magnitude, presumably because it is a few miles inland. Perhaps it is also no surprise that SeaTac is the least stormy spot, but the extent to which this is the case may not be well appreciated. Even in the more lively fall and winter seasons it only registers an hour or so a month on average with gust speeds of 40 MPH and higher. Seasonal cycles in high gust speed frequencies are evident but less pronounced at the Tri-Cities and Spokane locations. It is probably a fluke but the Tri-Cities ended up having the greatest total number of hours with strong gust speeds for the month of June.
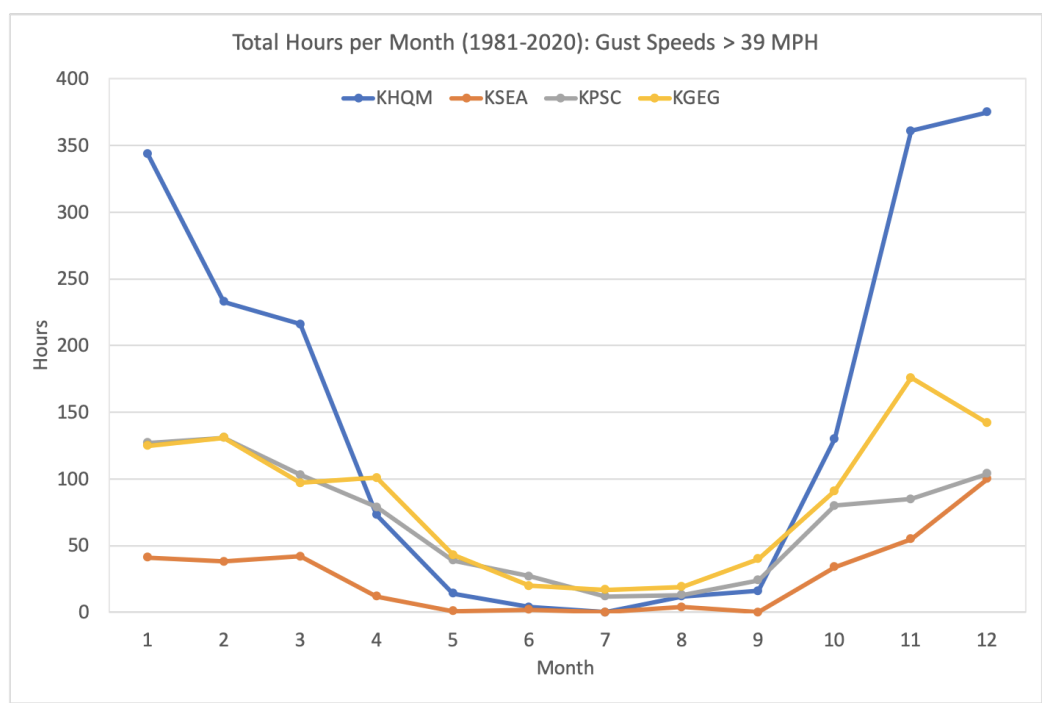 Figure 1: Total hours per month with wind gusts greater than 39 mph (1981-2020) for Hoquiam (KHQM), SeaTac (KSEA), Tri-Cities (KPSC), and Spokane (KGEG).
How have the number of hours with strong winds varied with time? The yearly totals of hours with mean wind speeds exceeding 29 MPH are shown in Figure 2. The traces reveal a great deal of interannual variability, with stormy years having 10 to 20 times as many hours of high mean wind speeds as relatively calm years. With regards to long-term trends, Hoquiam and the Tri-Cities seem to be getting windier by the present measure but given the background variability, these trends may not be very robust (analysis of the statistical significance of these trends is beyond the scope of the present piece). Both SeaTac and Spokane appear to lack any sort of systematic change over the period of 1981-2021.
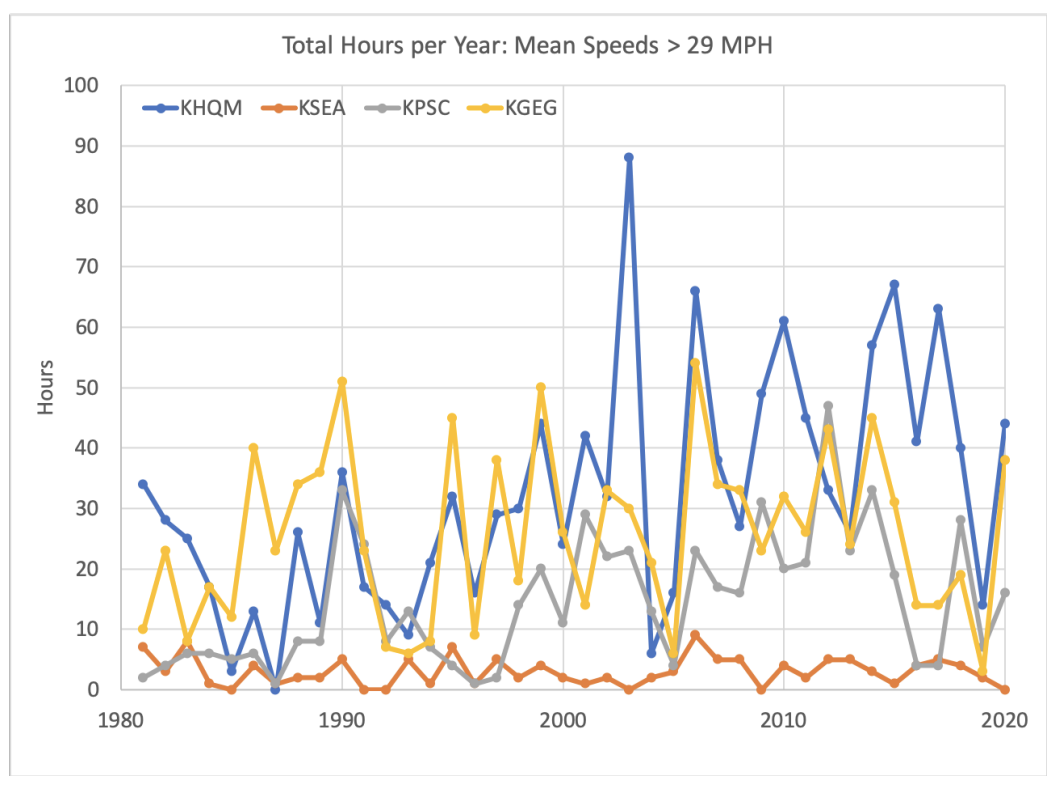 Figure 2: A time series of total hours per year (1981-2020) of mean winds greater than 29 mph for Hoquiam (KHQM), SeaTac (KSEA), Tri-Cities (KPSC), and Spokane (KGEG).
While we were at it, we thought it worthwhile to also count up the number of hours each year with gust speeds exceeding 39 MPH (Fig. 3). In many applications it is the maximum gust speeds that really matter in that the force of the wind is approximately proportional to the square of the wind speed, meaning that wind damage can often be attributed to the highest speed short-duration gusts rather than the lower velocity sustained winds. At least by eye, the time series of hours of strong gust speeds suggests greater upward trends than their counterparts for the hours of strong mean winds. How could this be? We wonder whether this may be attributable to changes in instrumentation and reporting practices. A period of modernization occurred during the early 2000s when cup anemometers were phased out and replaced by sonic anemometers. The former can be prone to the phenomenon “cup anemometer overspeeding” during periods of strong, turbulent winds, resulting in overestimation of mean wind speeds. Moreover, in past decades during which gust speeds were specified by human observers rather than continuous, high-frequency digital records, it is plausible that the strongest gust speeds could be missed. Additionally, without getting into the gory details, protocols for assigning gust speeds have evolved. The bottom line is that it is possible that the early part of the record considered here includes overestimates of the hours with high mean wind speeds and underestimates of the hours with high gust speeds, but that is speculation.
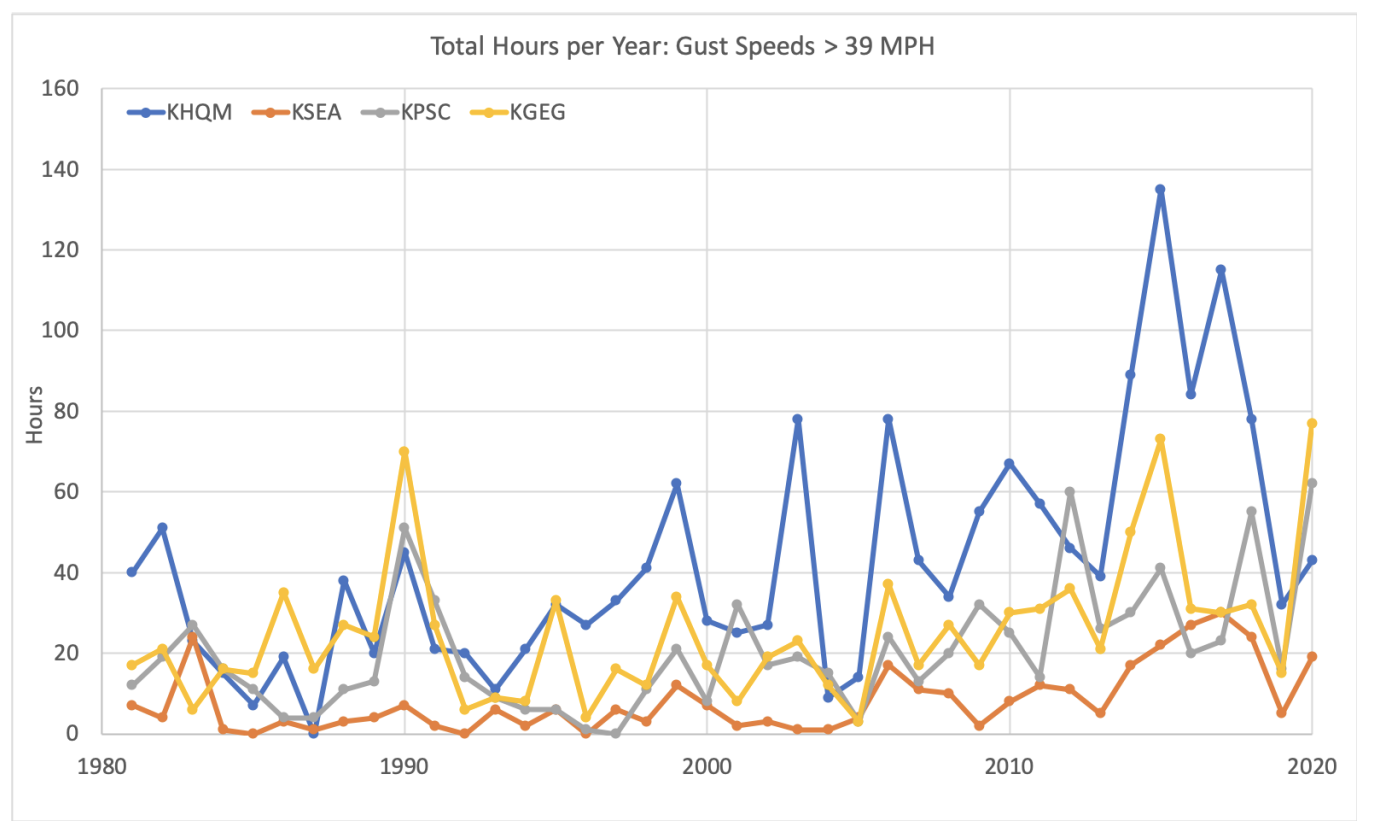 Figure 3: A time series of total hours per year (1981-2020) of wind gusts greater than 39 mph for Hoquiam (KHQM), SeaTac (KSEA), Tri-Cities (KPSC), and Spokane (KGEG).
One possible interpretation of the results shown here is that Hoquiam has experienced a real increase in the frequency of strong winds. But that conjecture may be tempered by the result from our examination of another aspect of the hourly data and that is the number of hours with sea-level pressure (SLP) reports of less than 992 hPa at Quillayute, assuming that landfalling storm systems account for most of the high winds. An upward trend in this measure is absent over the period of 1981-2020 (not shown). Given the inherent “noisiness” of the data sets considered here, a much more comprehensive analysis is required to say anything definitive about trends in windiness.
There are other topics related to strong winds that would seem worth pursuing. For example, how do periods of especially strong winds relate to periods of heaviest precipitation? Our greatest precipitation events tend to include brisk winds and vice versa, but their occurrences are not necessarily synonymous. If readers of this newsletter have any ideas about what should (and feasibly can) be looked into regarding hourly weather data from a climate perspective, we would like to hear about them.