Real-time Monitoring of the Climatic and Oceanic Forcing of the Waters of Puget Sound
Under the auspices of the Puget Sound Ecosystem Monitoring Program (PSEMP), with the support of the Puget Sound Partnership (PSP), a real-time system named the “Puget Sound Metrics Dashboard” has been developed to keep track of leading climatic and oceanic factors impacting Puget Sound’s water properties. This system is maintained by the Northwest Association of Networked Ocean Observing Systems (NANOOS) and as stated on its website, the intention is “to inform resource managers, scientists, health officials, and others” on current Puget Sound conditions. The specific metrics included relate to the strength of flows due to density differences, the exchange of heat at the air-sea interface, the effects of rain and streamflows on salinity, water column oxygen concentrations, and water properties on the Northwest WA shelf (which represent boundary conditions for the inland waters). The various metrics are updated weekly, and put in a climatological context based on past observations. Full descriptions of these metrics can be found on the dashboard at nanoos.org/products/ps_metrics/ home.php.
The OWSC was involved in the development of this monitoring system, with a focus on the component involving heat fluxes at the surface of Puget Sound. These fluxes are estimated for a North Sound region to the west of Whidbey Island, and a Central Sound region, as shown by the hatched areas on Figure 1. The locations of the observations that are used to specify the fluxes are also shown in Figure 1. Multiple station networks are used; the downward shortwave radiative fluxes are from AgWeatherNet stations on land, and the air temperatures, water temperatures, and wind speeds are from NOAA buoys, Coastal-Marine Automated Network (CMAN) stations, and tide stations. The net longwave radiation is estimated using the measured incoming solar radiation (insolation) as compared with clear-sky values to estimate cloud fractions, sea-surface temperature (SST), surface air temperature, and water vapor pressure, following Reed (2003). The sensible and latent heat fluxes are calculated using the “Lake Metabolizer” package in R. Detailed information on the methods used are on the dashboard’s website at the following url:nwem.ocean.washington.edu/PSmetrics/ Surface_Heat_Flux_Calculations.pdf.

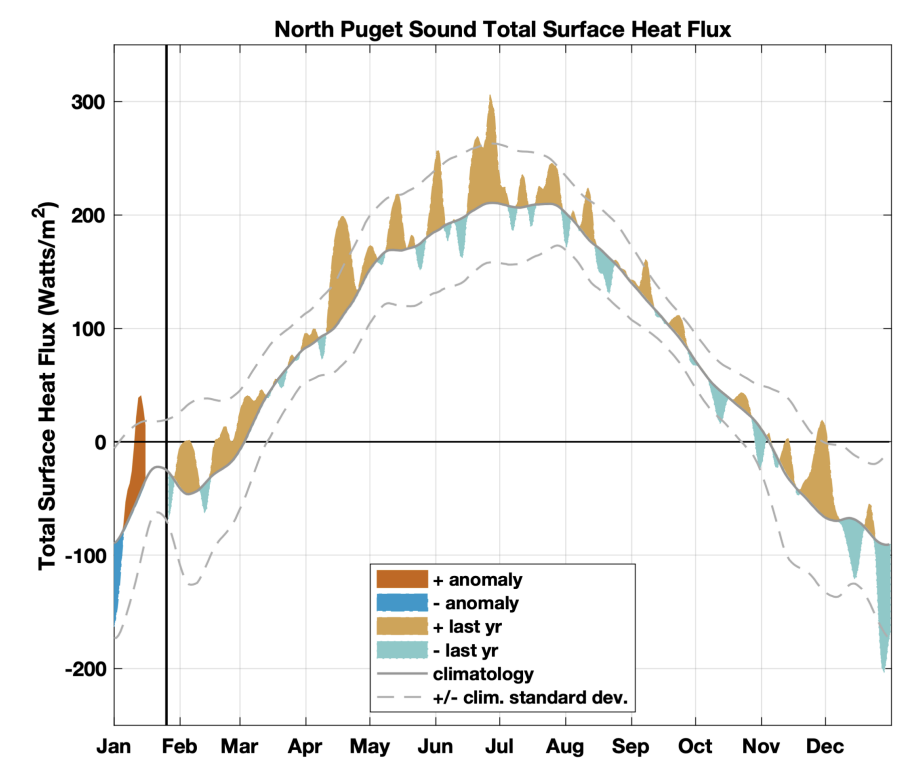
Figure 2, an example of what can be found on the dashboard, shows the net heat fluxes for the North Sound region as compared with climatological values for the period of late January 2021 through late January of this year. This time series has a variety of interesting features. For starters, in the climatological average – which incidentally includes some week-to-week variability associated with these averages being calculated over only 7 years by necessity – it is obvious that there is substantially more total heat gained by the ocean from spring through early fall than heat lost in the winter. Given this asymmetry, why do the water temperatures not just get warmer and warmer over time? The answer relates to the estuarine circulation that drives the exchange of the inland waters with those of the Pacific Ocean. In simple terms, the inflow is mostly colder water at depth with the outflow being warmer water near the surface and so in a net sense there must be a net heating of Puget Sound. With regards to the net heat flux anomalies estimated over the last year or so, the warm weather of spring through early summer 2021 is reflected by mostly positive heat flux anomalies interspersed with a few short and minor intervals of less heating than usual for the time of year. The greatest cooling, from both actual and anomalous perspectives occurred near the end of December 2021 into 2022 in association with unusually cold temperatures in western WA.
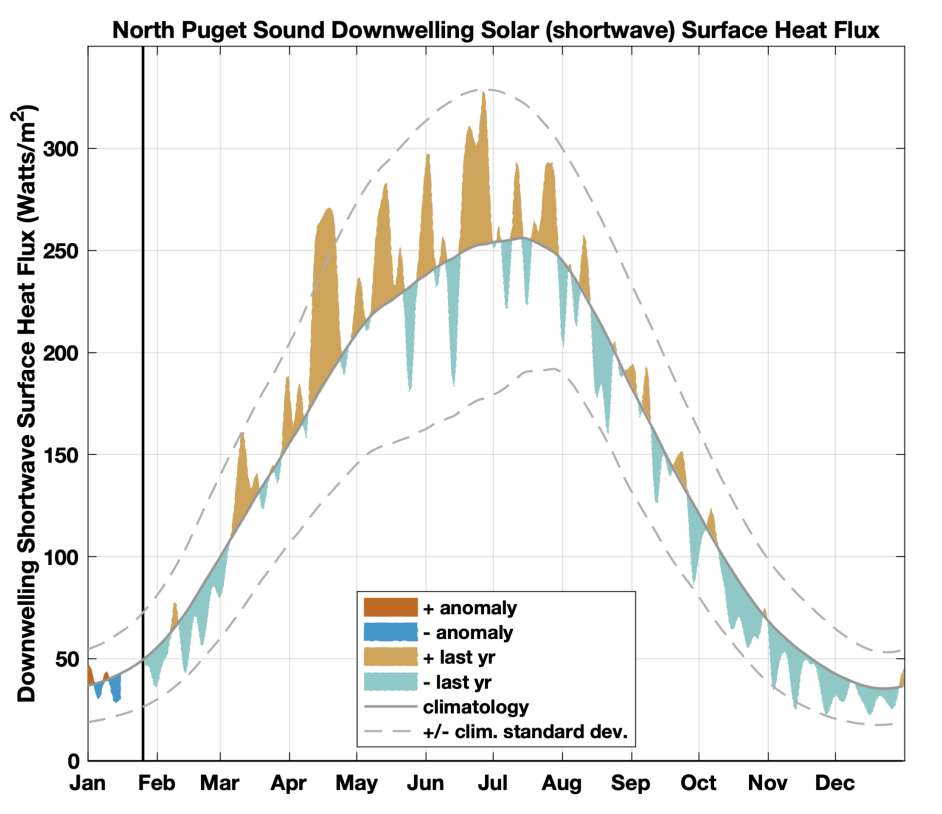
The dashboard includes a portrayal of the past year’s downward shortwave radiation, and an example of a recent screen shot is shown in Figure 3. Note that in the climatological average that this component of the surface heat fluxes has a peak in mid-July. While there is more clear-sky insolation at the time of the summer solstice, there also tends to be greater cloudiness in June than in July, resulting in a delay in the climatological peak heating. But many probably remember that late June of 2021 did not just feature a record-setting heat wave but also mostly cloud-free days, as reflected by shortwave heat flux values that reached their greatest for the year with values exceeding 50 W/m2 above normal. The fall and winter seasons are generally cloudy in the vicinity of Puget Sound but the time series of Figure 3 shows it was even gloomier than usual during the last three months of 2021. That being said, whether it is cloudy or clear does not have much of an impact on the net heating in the winter, with the magnitude of the anomalies on the order of only 20-30 W/m2. Moreover, clouds generally result in greater downward longwave radiation (not shown) that compensates for the lack of insolation. The residents of the Puget Sound region probably appreciate this in a related way, namely that the amount of sunshine in winter has little correspondence with air temperatures.
The dashboard was designed as a resource for individuals keeping track of the Puget Sound ecosystem and water quality; hopefully the regional climate community will also find it interesting and useful. We conclude this piece with recognition of the efforts of co-investigators Beth Curry, John Mickett (lead PI) and Jan Newton with the Applied Physics Laboratory of the University of Washington (Beth is now with MRV Systems, LLC). Special kudos go to John for all of the extra time he expended working with NANOOS towards putting our separate pieces together into a cohesive, real-time system.