By Haley Staudmeyer
Any Washingtonian can tell you that different areas of the state experience vastly different climates. But what terms can we use to describe those climates? Where are the boundaries between one climate and another? What metrics can be used to quantify climatological differences? It is useful for scientists across the globe to share a common language to answer these questions; this way, any region’s climate can be accurately described and understood in just a few succinct terms. Let’s dive into this language and how it describes Washington State.
The Köppen-Geiger climate classification system, designed by Wladimir Köppen in 1884 and later improved upon by Rudolf Geiger, is the most popular method by which climates are categorized (see Belda et al. 2014). It assigns an area a two- or three-letter code, which acts as shorthand for a lengthier description of its climate. The first letter of the code assigns an area to one of five main groups: A (tropical), B (dry), C (temperate), D (continental), and E (polar). These groups are assigned based on certain temperature and precipitation thresholds. For example, for an area to be classified as tropical, every month of the year must have an average temperature of at least 18 °C (64.4°F) and experience significant precipitation. The following one or two letters in the code assign a temperature subgroup and/or a precipitation subgroup based on more granular climatic thresholds. As examples, w indicates a climate that experiences a relatively dry winter, and c indicates a relatively cold summer.
There are enough groups and subgroups within the Köppen-Geiger system that describing each of them in detail is beyond the scope of this article. Surprisingly, even when only considering those found of Washington State, there are still too many to cover in great detail here. Figure 1 shows a map labeling Köppen-Geiger climate types across the state. Fourteen different climates can be found in the state, spanning each of the five main groups except tropical. Compare this map of Washington State to that of the entire country (Figure 2). East of the Rocky Mountains, the country is dominated by just three climate types. Entire states can be subsumed by a single climate type. States west of the Rockies exhibit more diversity in climate, but even California, for all its area, cannot boast more climate types than Washington.
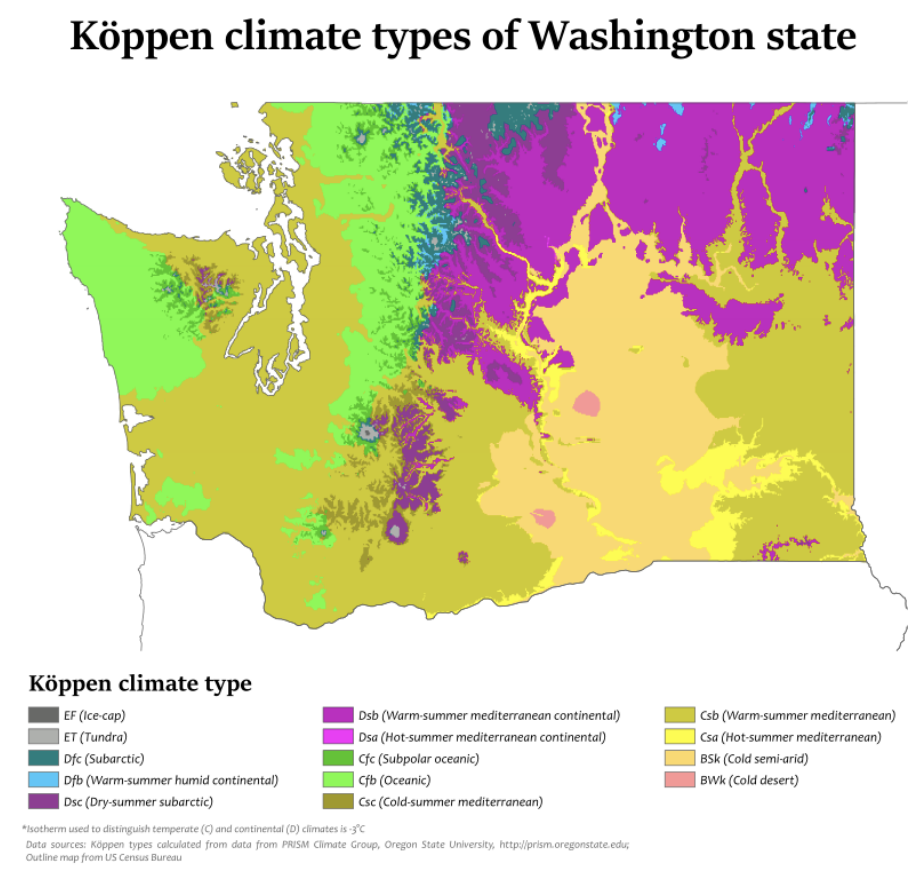 Figure 1: Köppen-Geiger climate types for Washington. Map created by Adam Peterson (Wikimedia) based on the PRISM high resolution 1981-2010 climate normals.
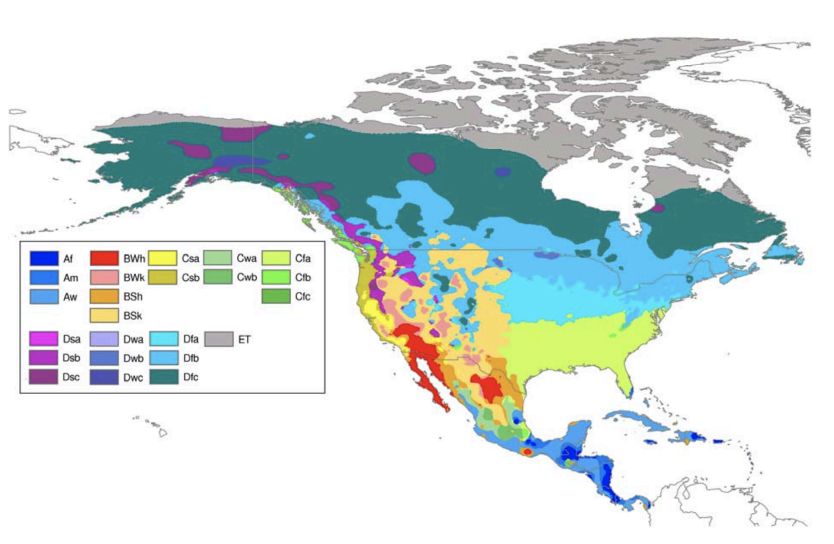 Figure 2: Köppen-Geiger climate types of North America from Peel et al. 2007.
Most of Washington state is defined as either temperate (C) or continental (D). Both groups indicate a climate with more seasonality than tropical or polar regions. Continental climates experience at least one month out of the year where average temperatures reach below freezing; temperate climates do not. Mediterranean climates occupy the largest portion of Washington, and they are characterized by mild winters and dry summers. The oceanic climates found on the Olympic Peninsula and on the west slopes of the Cascade Mountains feature more mild summers. Central-eastern Washington is defined as dry, but also earns the label cold, as it is not quite as hot as other arid regions of the world.
Somewhat confusingly, many of the oceanic regions of Washington aren’t found on the coast, and the state’s mediterranean regions are all very far from the Mediterranean Sea. Additionally, the criteria used to define each climate group and subgroup is not universally agreed upon, meaning that some regions can be feasibly assigned multiple climate types. This makes the Köppen-Geiger climate classification system difficult for the non- specialist to use, even if one works up the nerve to unscramble its cryptic two- or three-letter codes. Climatologists have no shortage of gripes with the system, too. It relies heavily on averages and does not account for many important defining features of climates, such as cloud cover or intensity of precipitation.
Other climate classification systems (such as the Trewartha system) exist, yet in spite of its flaws, the Köppen-Geiger system remains the most popular by far. Of course, by its very nature, a perfect climate classification system cannot exist. Obtaining information about a region’s climate in a nutshell requires glossing over its finer details. For a newsletter focused on the state of Washington, though, a suitable alternative may exist. Regular readers of this newsletter may recall a series of highlights summarizing the various climate divisions of Washington State as assigned by NOAA. For considerations restricted to a single state, NOAA’s climate divisions are theoretically more useful than the Köppen-Geiger system, as they can be more accurate without creating too many terms to keep track of. In practice, though, finding information on any given climate division’s characteristics is fairly difficult – hence, OWSC’s effort to document all of Washington’s. Additionally, climate divisions are not defined outside of the United States, making them ill-suited as tools for global climate comparisons.
The OWSC does not employ a professional graphic designer, so we have done our best to overlay NOAA’s climate divisions onto the map of Washington’s Köppen-Geiger climate types in Figure 3. Though we cannot guarantee the figure’s accuracy along the borders of divisions, the comparison yields interesting results. The boundaries of some climate divisions, like 9 (Northeastern) and 10 (Palouse Blue Mountains) slot together easily with their Köppen-Geiger counterparts. Other climate divisions further subdivide regions that share the same Köppen-Geiger climate type, such as 2 (NE Olympic-San Juan) and 3 (Puget Sound Lowlands). Comparing the similar figures from our analyses of these two climate divisions reveals significant differences between them. This is perhaps one example where the greater specificity of climate divisions may be preferable.
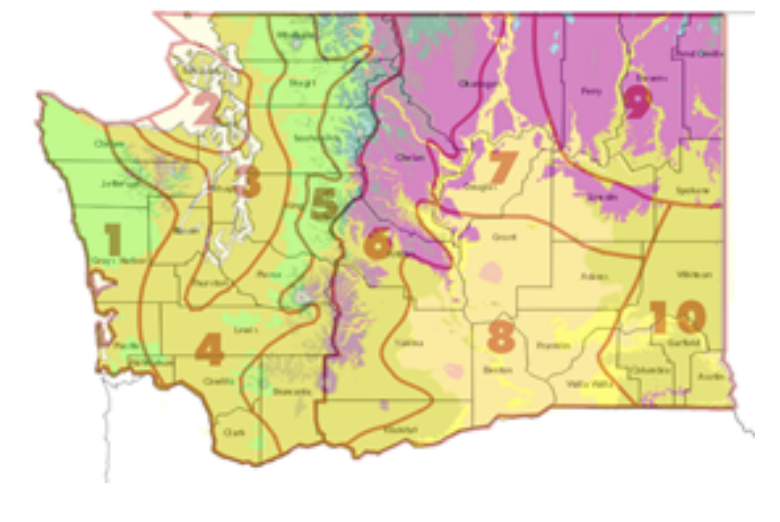 Figure 3: NOAA’s Washington climate divisions overlaid onto the Köppen-Geiger map of Washington from Figure 1.
However, other climate divisions in the state, such as 5 (Cascade Mountains W), encompass many different Köppen-Geiger climate types. Much of including this region into a broad-brush climate division is due to the lack of station data in the higher terrain, so the mountain microclimates are undoubtedly smoothed over in the climate division breakdowns. There is also the problem that average temperature and precipitation are changing due to human-driven climate change. It may be easier to change a particular weather station’s Köppen-Geiger code than to redefine entire climate division boundaries in the coming years. All this to say, there may still be some reasons to prefer the Köppen-Geiger system, even on a statewide scale.
Our biggest takeaway from this discussion is an understanding of how complicated and varied the climates of Washington State are. We at OWSC try to stay on our toes in accounting for all the intricacies of Washington’s many climates in our various projects. It also serves as a reminder as to just how diverse the state is in other ways – after all, a region’s climate can determine its vegetation and wildlife, agriculture, available jobs, civil necessities, and more. What strikes you the most from this analysis? As always, feel free to email/ tweet/Facebook us your feedback(climate@atmos.washington.edu; @WAStateClimate).
References
Peel, M.C., B.L. Finlayson, and T.A. McMahon, 2007: Updated world map of the Köppen-Geiger climate classification, Hydol. Earth Syst. Sci., 11, 1633-1644.
Belda, M., E. Holtanová, T. Halenka, J. Kalvová, 2014: Climate classification revisited: from Köppen to Trewartha, Clim Res, 59, 1-13.