By Nick Bond
There is a large and growing number of web applications serving climate data. Notably, the U.S. Climate Resilience Toolkit (toolkit.climate.gov/ tools) has over 500 digital tools in its catalog catering to a wide range of users. Here we show some examples from just one of these applications, the Climate Explorer: https://crt-climate-explorer.nemac.org/
The Climate Explorer focuses on historical records and climate projections for the counties of the United States. Historical values are provided for both individual cities as well as counties; the former are selectable off a map produced when a particular county is selected. The variables range from average temperatures and total precipitation to the number of days with temperatures or precipitation amounts at various thresholds, with the results shown for years as a whole, or by month for groups of years. Some of this output is expressed as deviations from normal, with the climatological norms based on the period of 1961-1990. Here we illustrate one type of historical data available, namely counts of the number of days with precipitation totals reaching 1.00” at Sea-Tac (Figure 1a) and 0.50” at Spokane (Figure 1b) through 2020. These kinds of measures, rather than annual precipitation totals, may be more relevant to some issues, in this case such as stormwater design capacity. Both locations appear to lack much if any change in the annual number of very rainy days, at least in the historical record through 2020. Many more options including maps are available for surveying historical data sets.
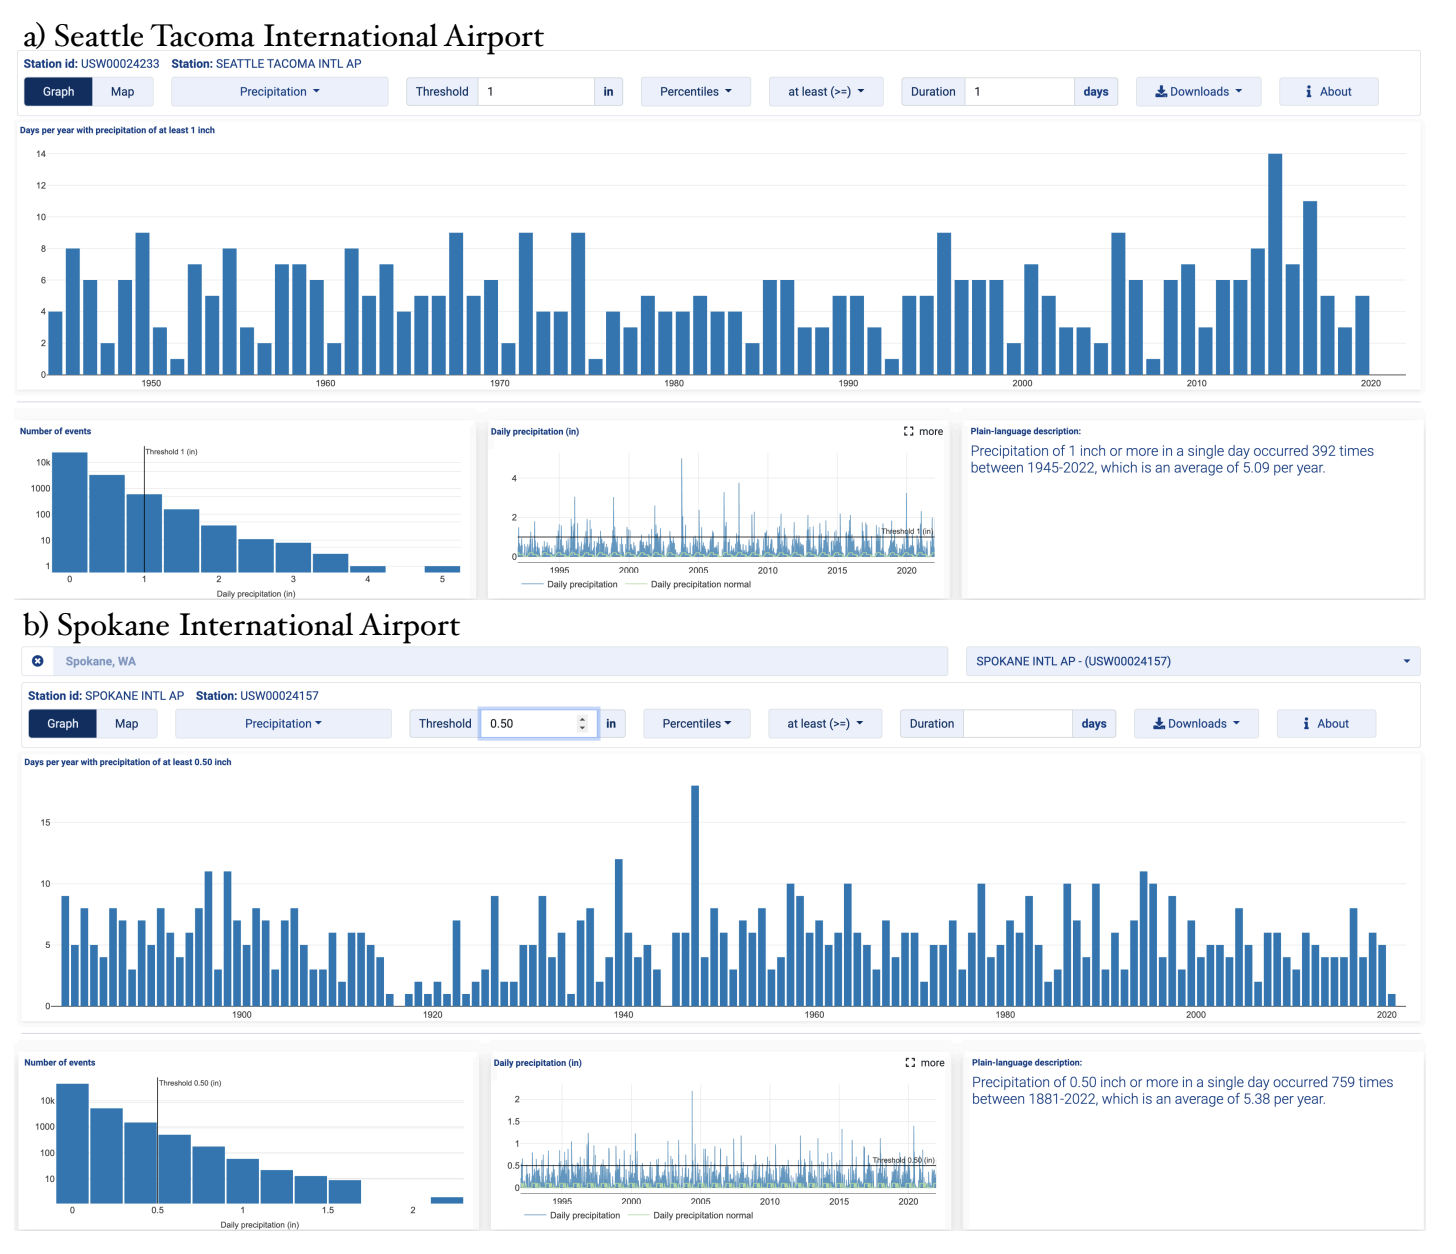 Figure 1: Days per year of precipitation of at least a) 1.00” at SeaTac Airport and b) 0.50” at Spokane International Airport through 2020 (Climate Explorer).
There are also a variety of ways to visualize climate projections through the remainder of the century. Results are available for 32 model ensembles from both the RCP4.5 and RCP8.5 scenarios of CMIP5, which perhaps can be thought as representing a range from something close to a best case to a worst case in terms of future greenhouse gas emissions and concentrations. The climate models used in these projections have coarse horizontal resolutions, and their output is statistically-downscaled to a 1/16 degree grid using the localized constructed analogs method (LOCA; Pierce et al. 2014). This technique picks the best analog day in the observations, accounting for local spatial scales of coherence, towards specifying the local area in the vicinity of a grid cell being downscaled. It is designed to be able to handle extreme events more realistically than some of the other statistical downscaling techniques. That being said, all downscaling methods have their drawbacks, and in some cases the most meaningful comparisons are between model results for future versus historical periods, as provided by the Climate Explorer.
Examples of such comparisons are shown here for two measures of hot temperatures, specifically cooling degree days (Figure 2a) and annual counts of days reaching 90°F (Figure 2b), with specific results for King County shown as insets. Days above 90°F in King County, are expected to average between 4 and 7 per year by the 2050s, according to Figure 2a. The maps shown in Figures 2a-b are screenshots; in practice the slider bar represents an effective way to see how these kinds of measures of the climate are projected to change. In the screenshots shown, everything to the left represents the historical 1961-1990 average while everything to the right shows the 2050s ensemble projection. Note that there is the option to download the results shown in graphs and maps — both historical and model data — for further analysis.
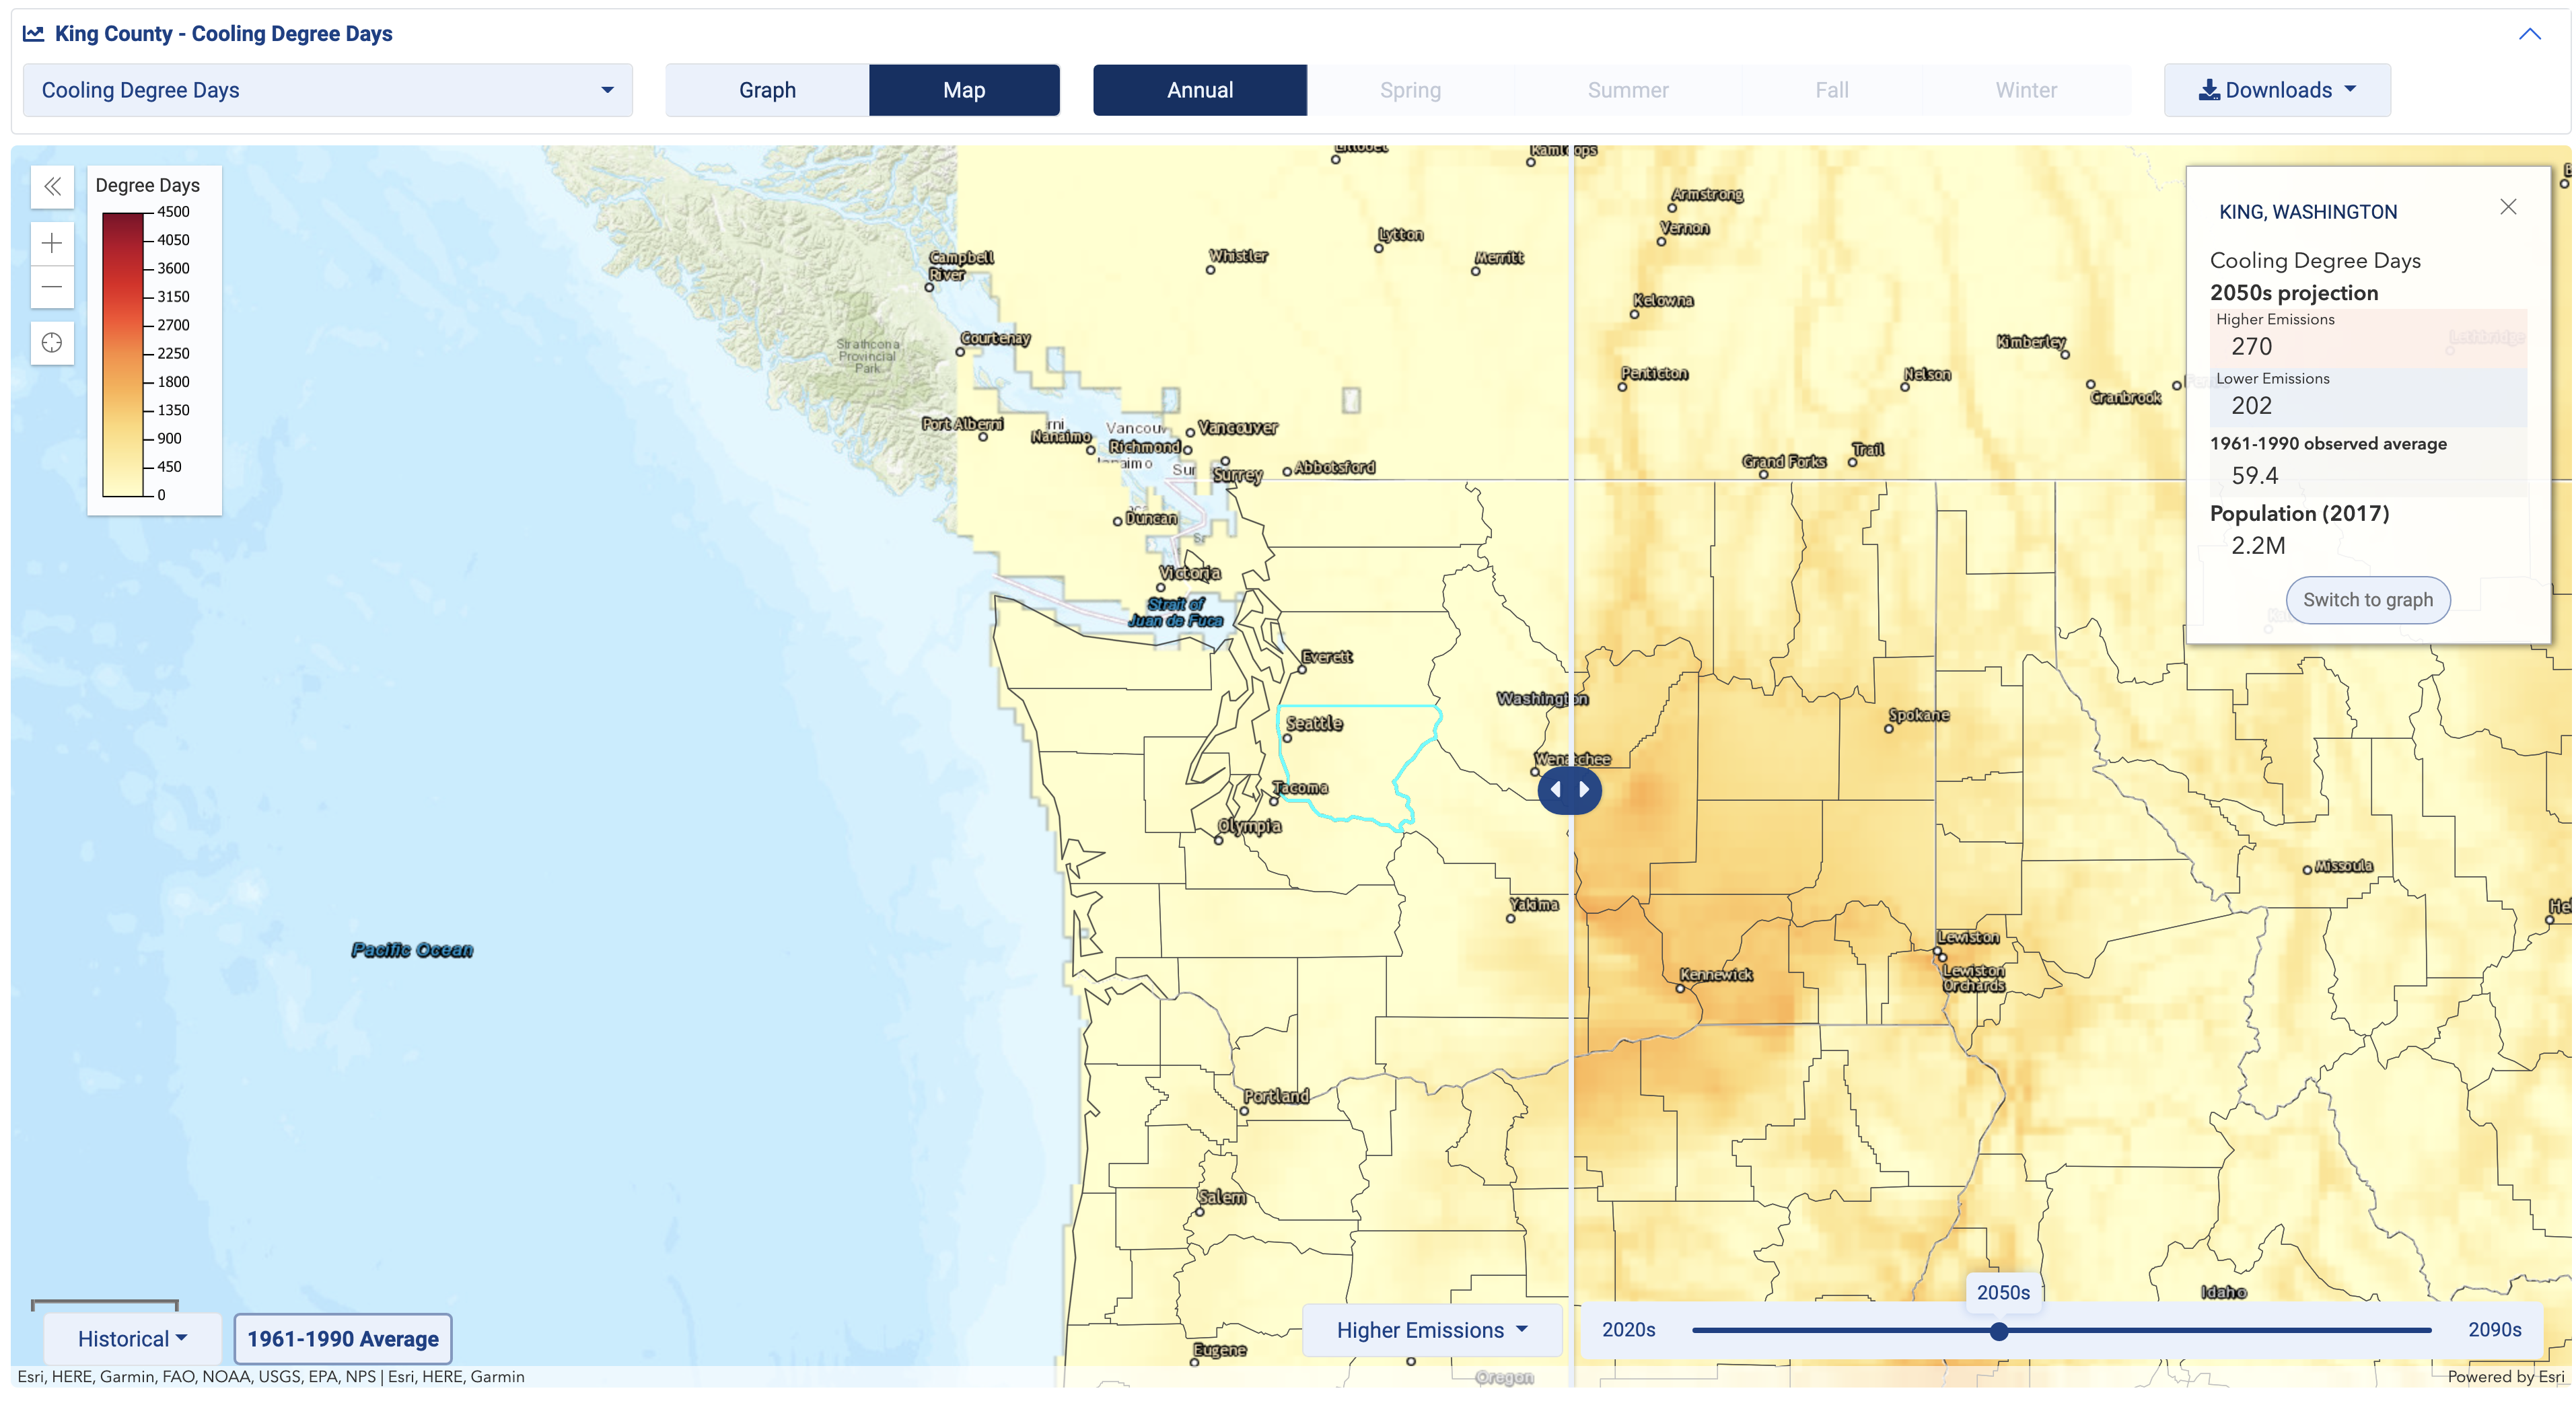 Figure 2a: Cooling degree days per year year with maximum temperatures exceeding 90°F for the period of 1961-1990 (left of the slider bar) versus projected for the 2050s. The inset on the upper right refers to King County, WA as a whole (Climate Explorer).
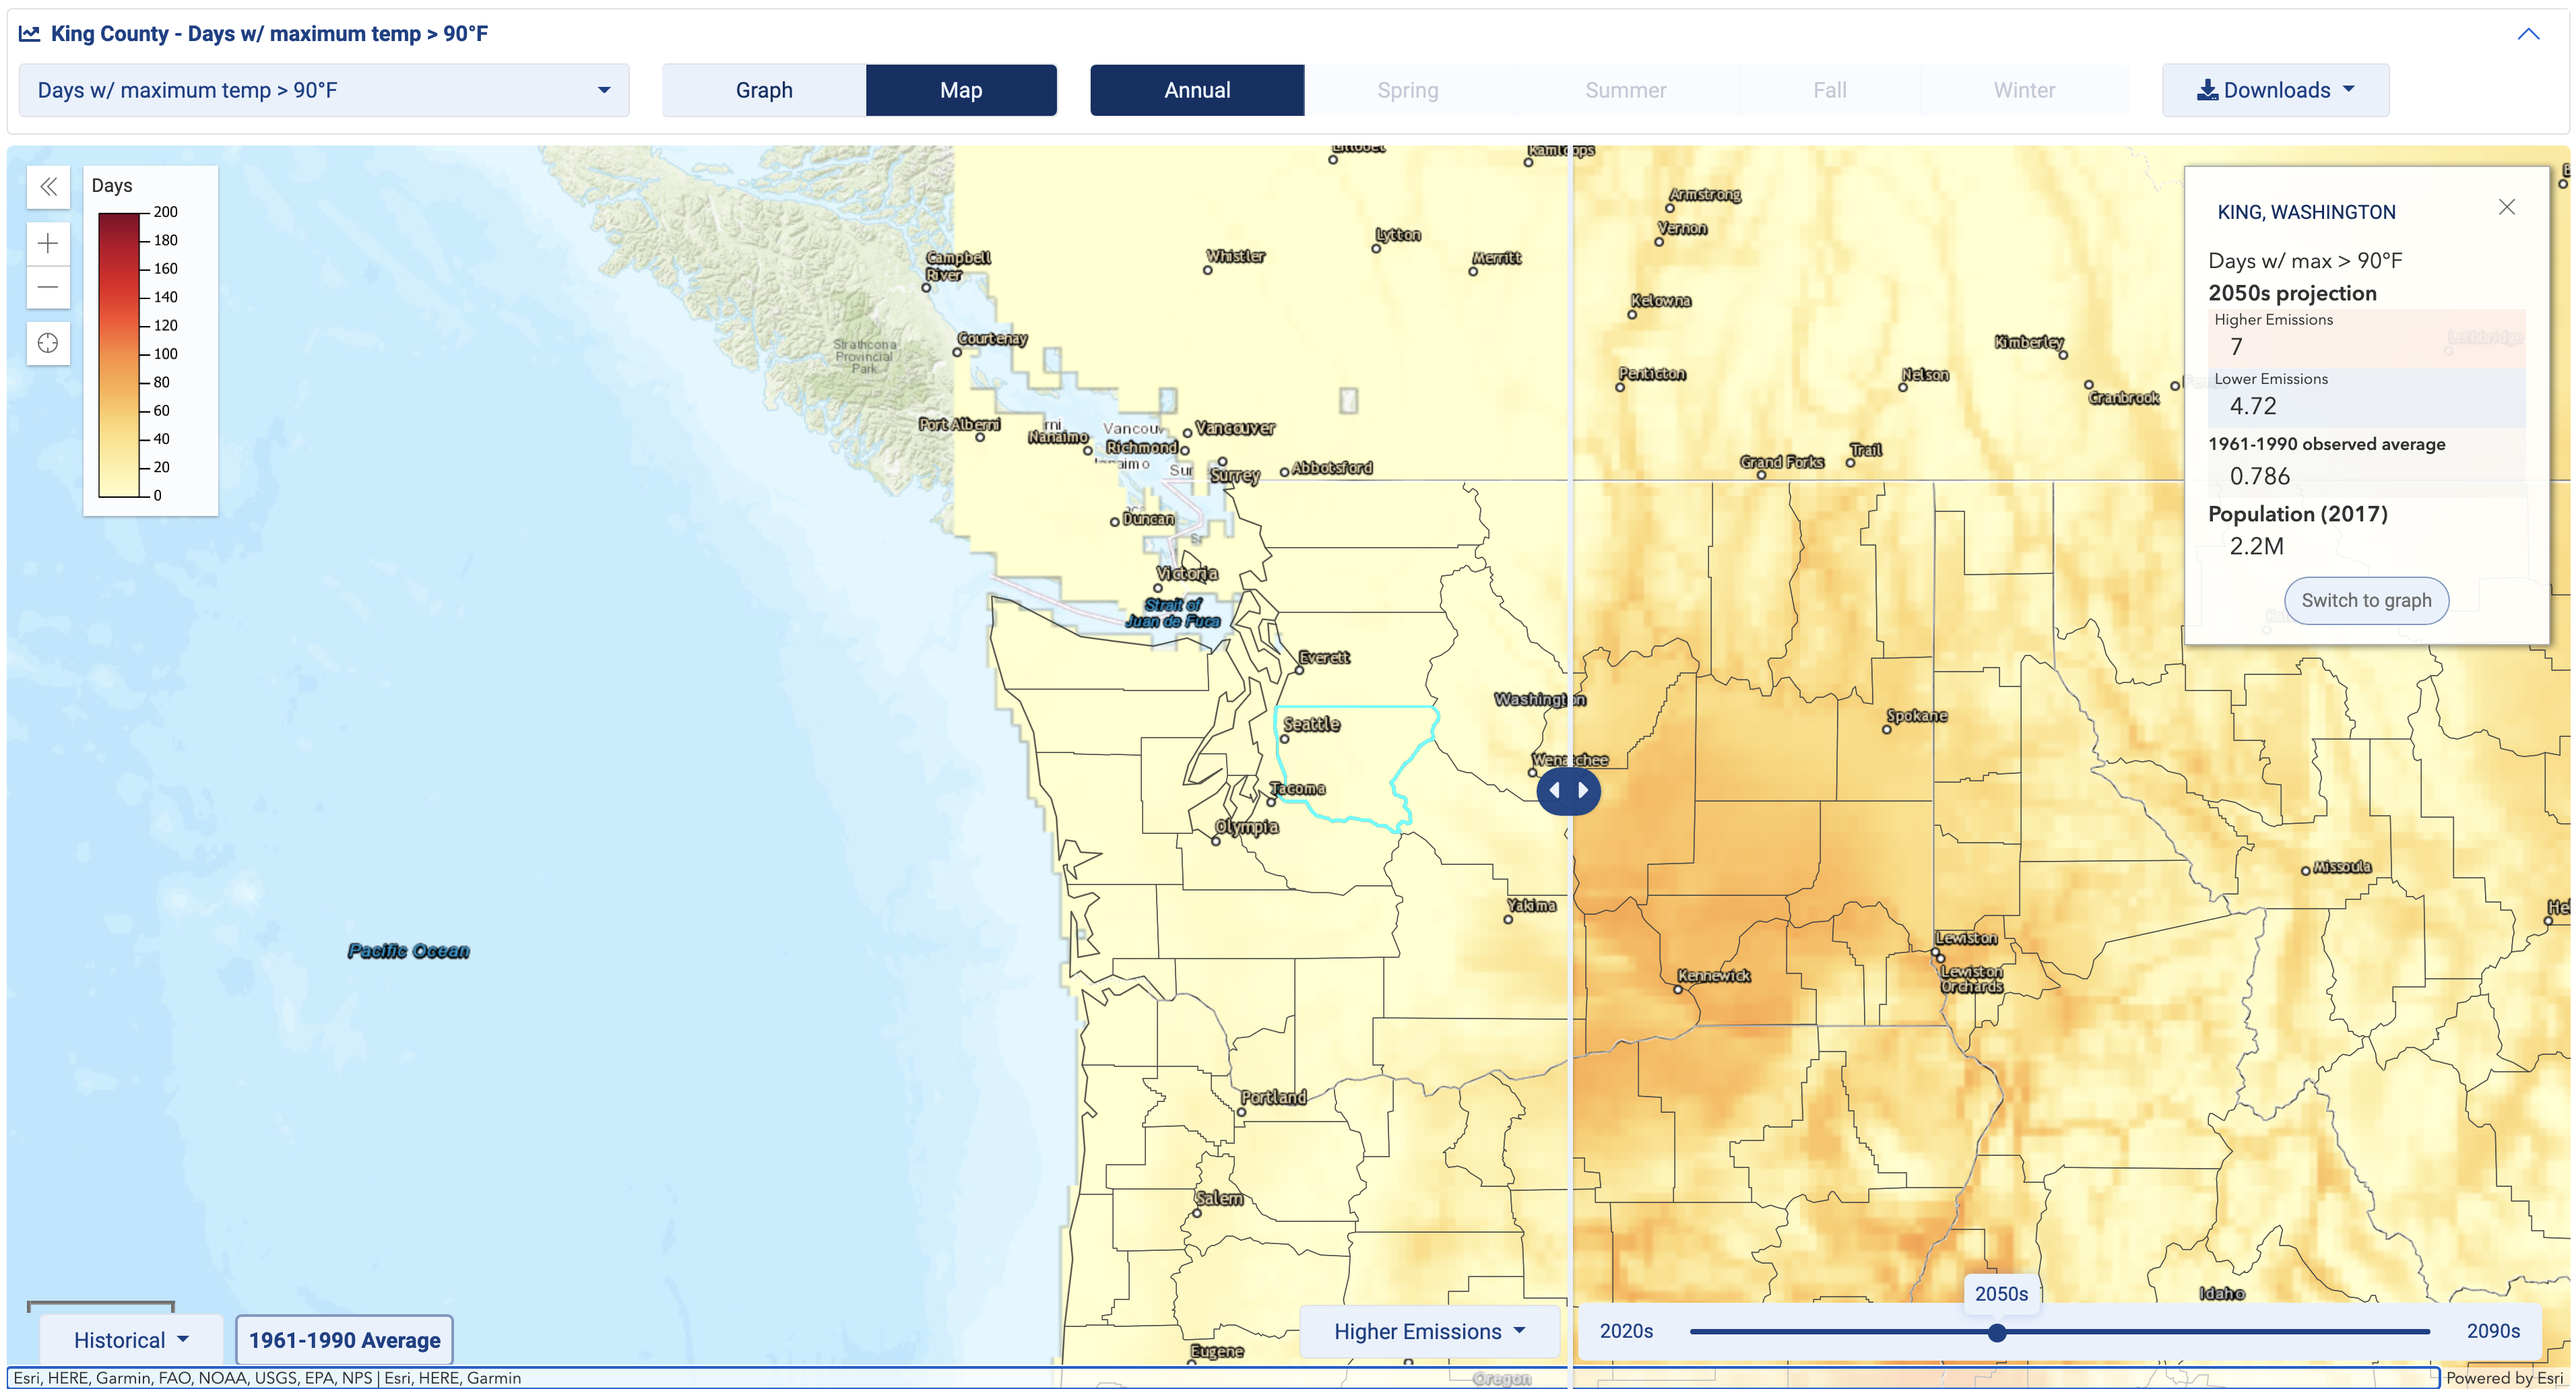 Figure 2b: Number of days per year with maximum temperatures exceeding 90°F for the period of 1961-1990 (left of the slider bar) versus projected for the 2050s. The inset on the upper right refers to King County, WA as a whole (Climate Explorer).
The present piece cannot do justice to all that is available through the Climate Explorer, with the U.S. Climate Resilience Toolkit representing a vastly more extensive resource. So we will stop here and encourage you to rummage around for yourself.
References
Pierce, D.W., D.R. Cayan, and B.L. Thrasher, 2014: Statistical downscaling using localized constructed analogs (LOCA). J. Hydrometeorology, v.15, 2558, doi:10.1175/JFM-D-14-0082.1
U.S. Federal Government, 2021: U.S. Climate Resilience Toolkit Climate Explorer. [Online] https:// crt-climate-explorer.nemac.org/ Accessed July 6, 2022.