By Nick Bond
This month’s highlight is inspired by the unusually long-lasting heat wave in WA that occurred during the last week of July 2022. We were interested in how the frequency of hot temperatures, in terms of not just maximum but also minimum values, changes over the latter part of summer. For this purpose, we have simply counted up the number of days that thresholds of specified maximum and minimum temperatures were met during the period of 1 August through 15 September during the 30-year block of 1991 through 2020, and the 30-year block of 1961 through 1990. This exercise was carried out for 5 locations: Sea-Tac (KSEA), Olympia (KOLM), Yakima (YKM), Spokane (KGEG) and Pullman (KPUW) using arbitrarily- specified thresholds for each location that represent roughly 97 to 99 percentile values for the interval of 1-15 September (the last one-third of the entire period considered). In other words, the focus is on the frequency of unusually hot, but not necessarily record-setting, days and nights, and how soon we can reasonably expect to be no longer facing the threat of more uncomfortably high temperatures.
Total counts of the hot days and nights for the first and second halves of August, and the first half of September, for the years of 1991 through 2020 at the 5 locations in WA state listed above, are itemized in Table 1. The counts for the individual days from 1 August through 15 September at KSEA and KGEG are shown in the bar charts of Figure 1. During the years of 1991 through 2020, there was a steep drop-off after about 20 August in the number/frequency of the hot days and to a lesser extent the hot nights. This timing is consistent with the heat wave study of Bumbaco et al. (2013), which identified intense events west of the Cascades of 3-days and longer duration of which there none of the hot day variety after 13 Aug (JD 225) and none of the hot night variety after 18 August (JD 230). For east of the Cascades, there is even a greater decrease in heat events with time over late summer. Considering the 3 east side stations together (Table 1), hot nights (days) are about 10 (5) less likely during the first 15 days of September compared to the first 15 days of August. These numbers depend on the thresholds chosen to define hot days and nights at each location, of course, but we expect the proportions of 1-day events during the different times of year are not highly sensitive to the thresholds. And at the very least, we trust that most will agree that a day that reaches 90°F on the west side, and 95°F on the east side of the Cascades, constitutes a hot day.
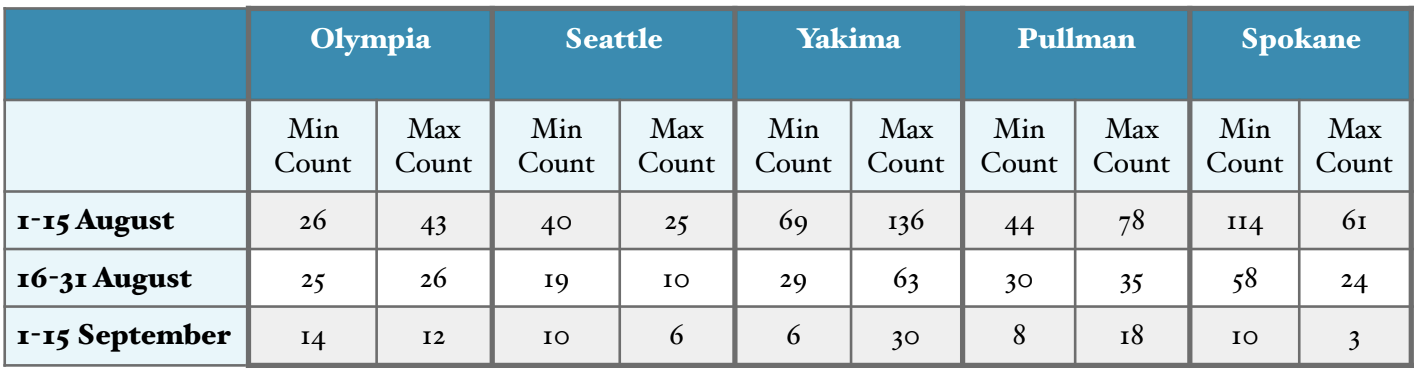 Table 1: The number of hot nights and hot days during 1991-2020.
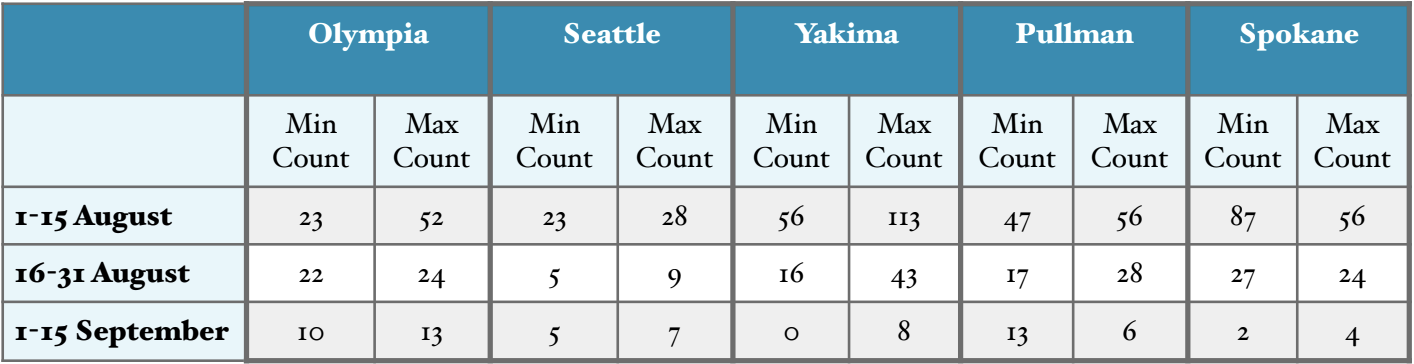 Table 2: The number of hot nights and hot days during 1961-1990.
We will now go further back in time and consider the 30-year period of 1961-1990. The counts for the individual days of the year at KSEA and KGEG are shown in Figure 2; the total counts for the half month intervals from the start of August until mid-September at the 5 WA locations are itemized in Table 2. Given the overall increases since 1895 in summer (June-August) of about 1°F in the maximum temperature and 3°F in the minimum temperatures for WA state as a whole, it is not surprising that most of the counts for the 30-year period of 1961-1990 are lower than their counterparts for 1991-2020. As shown here, this is especially the case for the hot night counts during the latter part of August and first part of September. We note that the western stations of KOLM and KSEA had some hot days during the middle of September in the years of 1961 through 1990, illustrating that it was possible to get some heat quite late in the summer in the past as well as now, though it was less likely.
Increases in the probability of hot temperatures in late summer are liable to have implications for natural and human systems in the Pacific Northwest. There are a variety of ecological studies that show that climate change is liable to have important impacts on the phenology of natural systems, i.e., through disruptions in the timing of processes in these systems. That being said, we close with the good news from a human perspective, namely despite the upward creep in our summer temperatures over the years, we should draw comfort that the odds of hot weather will greatly diminish in a few weeks.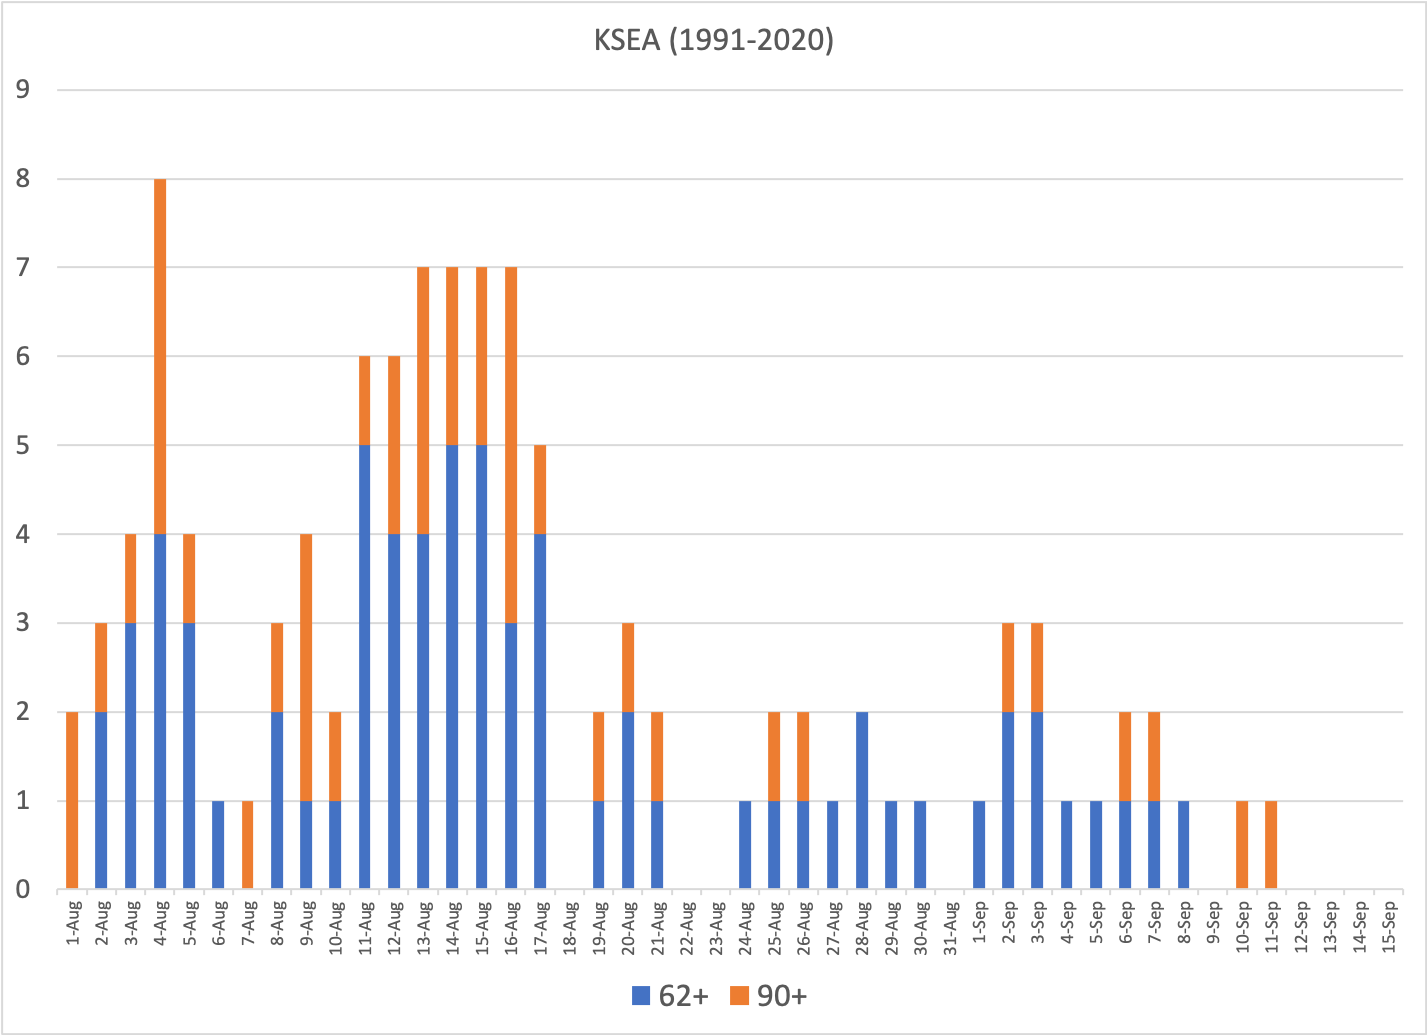
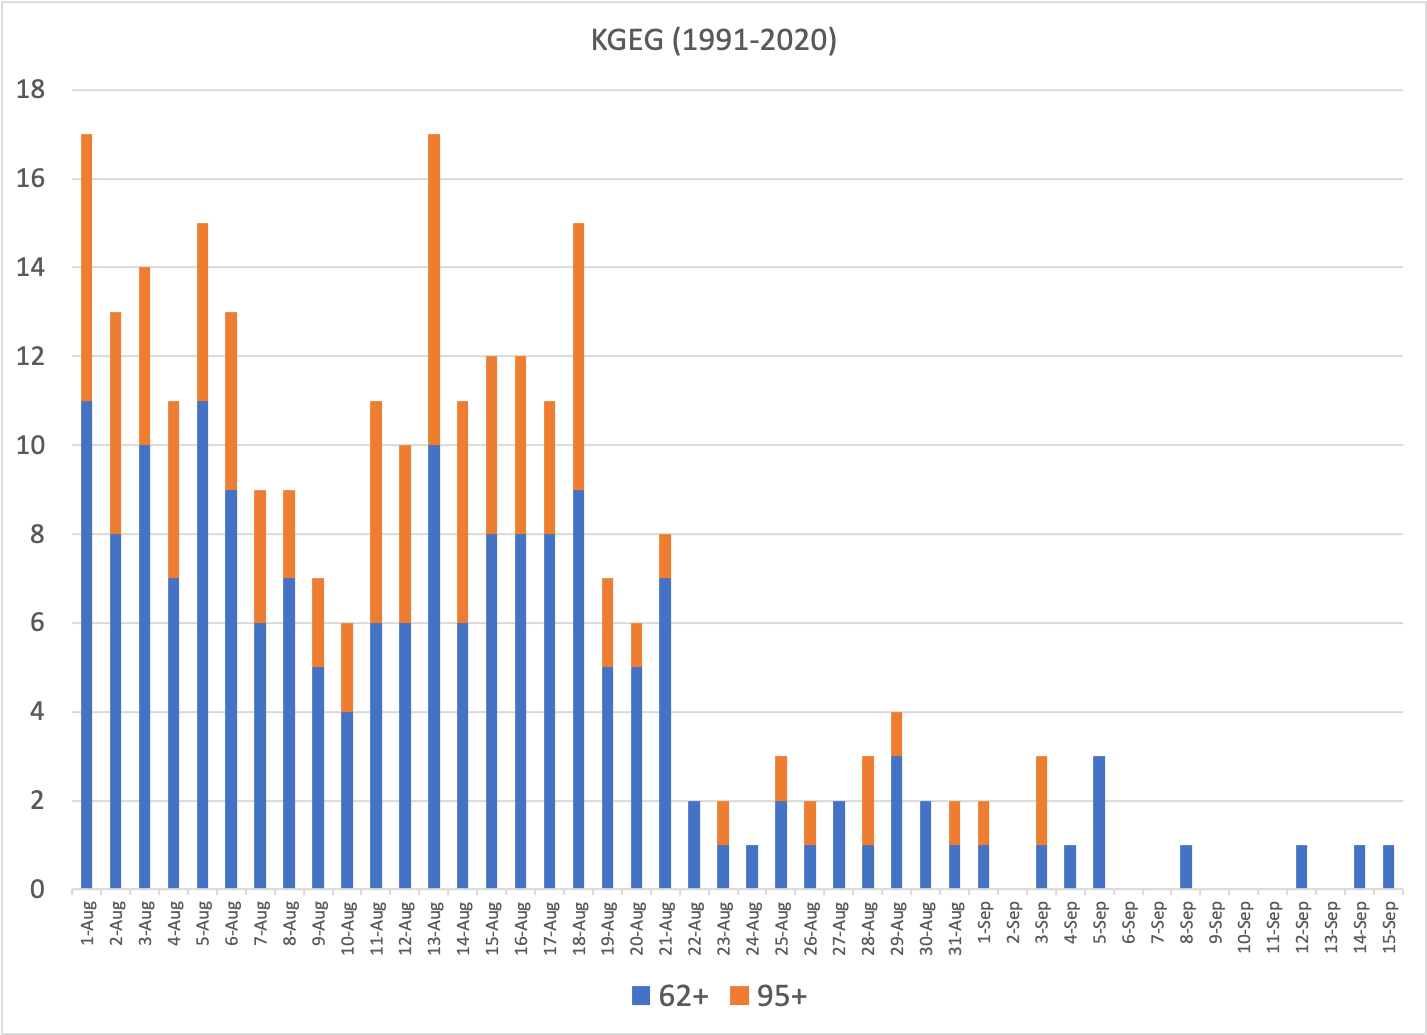 Figure 1: The number of warm days and nights at SeaTac Airport (top) and Spokane (bottom) in the 1991-2020 period. Warm days were classified as those 90 or above for Seattle and 95 or above for Spokane. Warm nights were defined as 62 or above for both.
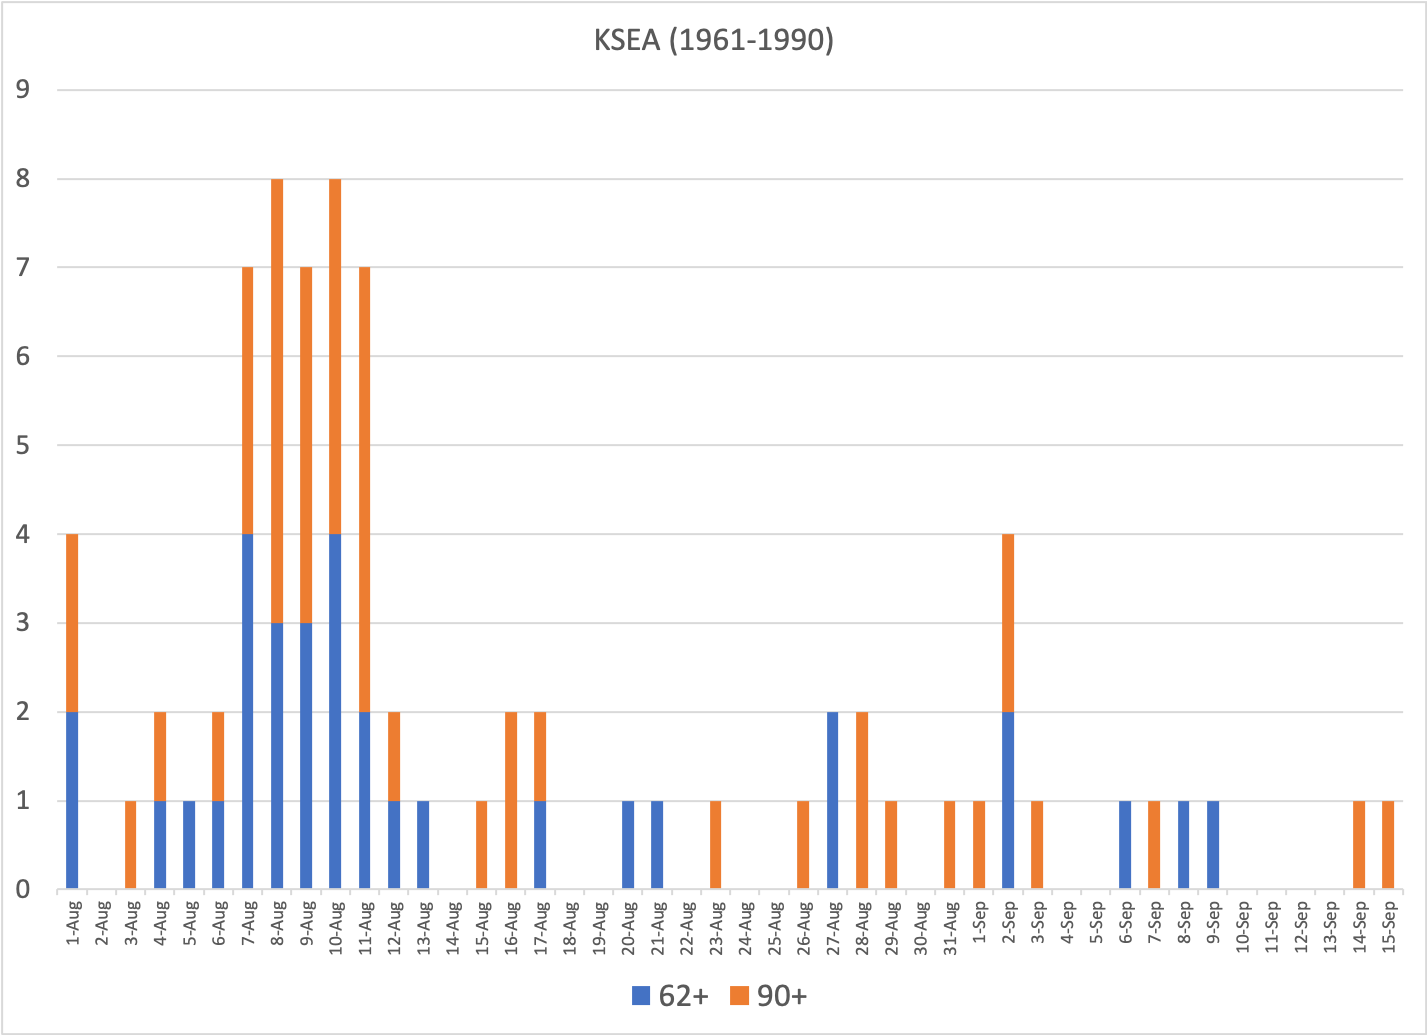
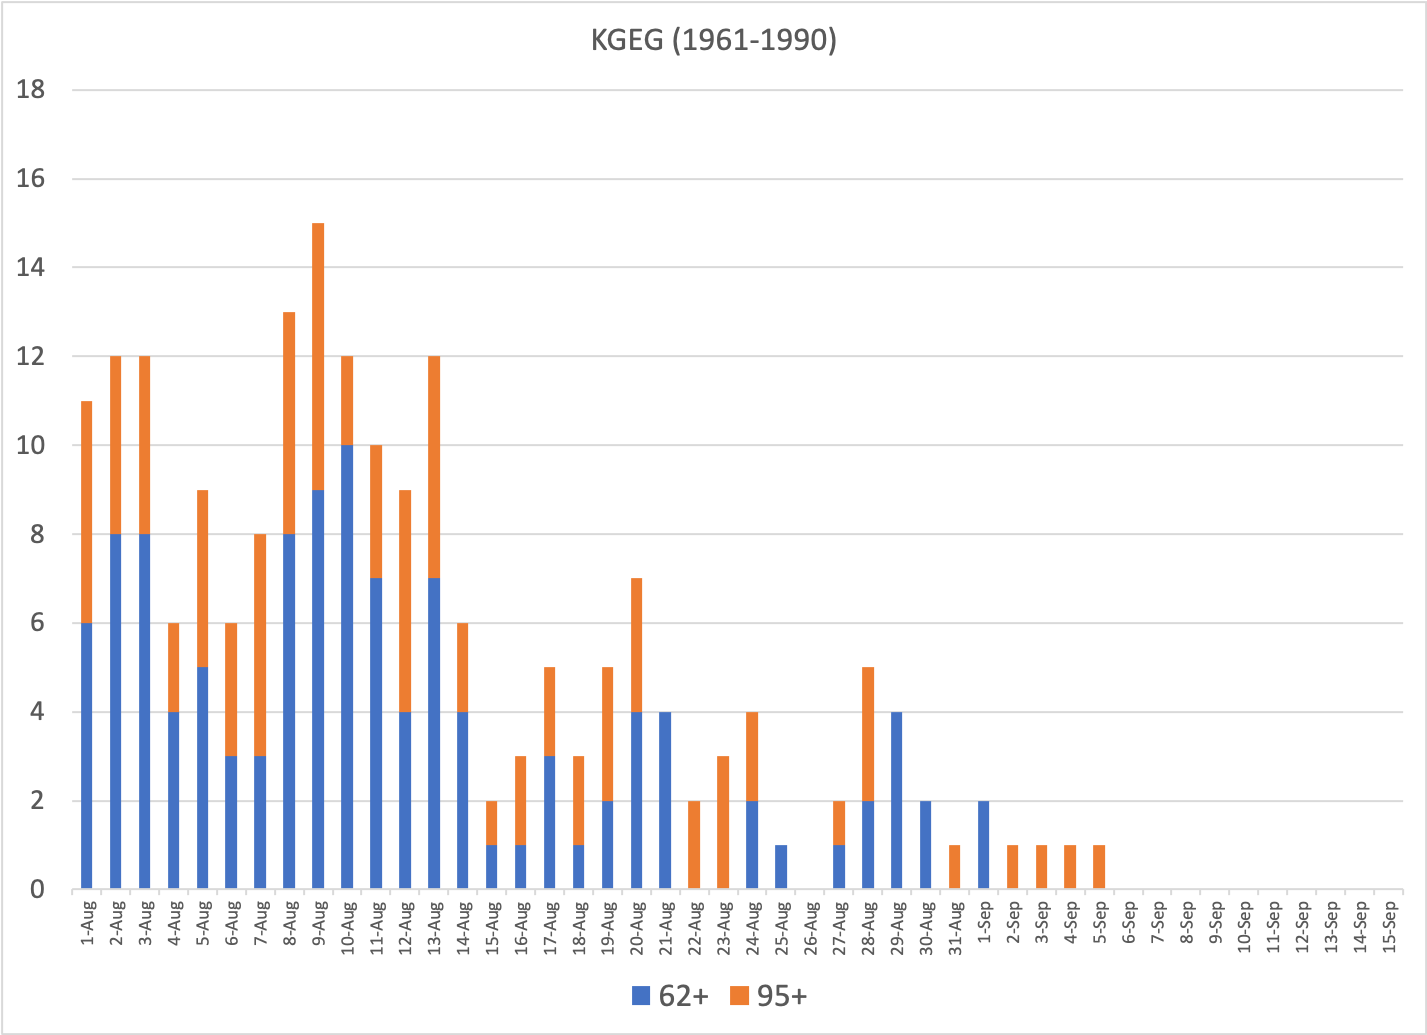 Figure 2: As in Figure 1, except for the 1961-1990 period.