By Nick Bond
The last few months have featured considerable fluctuations in precipitation across WA state relative to seasonal norms. While such fluctuations have certainly occurred in the past and will continue to be part of our climate, they serve as a good excuse for taking a quick look at some of the observed temporal and spatial variability in winter precipitation in WA state.
We begin with a survey of WA state mean precipitation totals for the months of December, January and February for the years of 1895-2022 from the historical record as catalogued on NOAA’s Climate at a Glance website (Fig. 1). One’s first impression might be that Figure 1 is a mess, and that is kind of the point. There are negligible trends in mean precipitation amounts, or in the interannual variability in these amounts. There are three extremely wet months in the first half of the record, namely December 1918, December 1934 and January 1953 but otherwise nothing much that stands out. It is difficult to tell by eye, but the correspondence between the totals for the individual months comprising each winter is also negligible. More specifically, the linear correlation coefficient between the total for December and the following January is only about 0.15, explaining merely about 2% of the variance, and even smaller values are for December versus February, and January versus February. The bottom line is that one should guard against elation, or despair, depending on how the early part of the winter plays out around here. Given these more or less null outcomes, perhaps there are more interesting results related to the spatial patterns in winter precipitation.
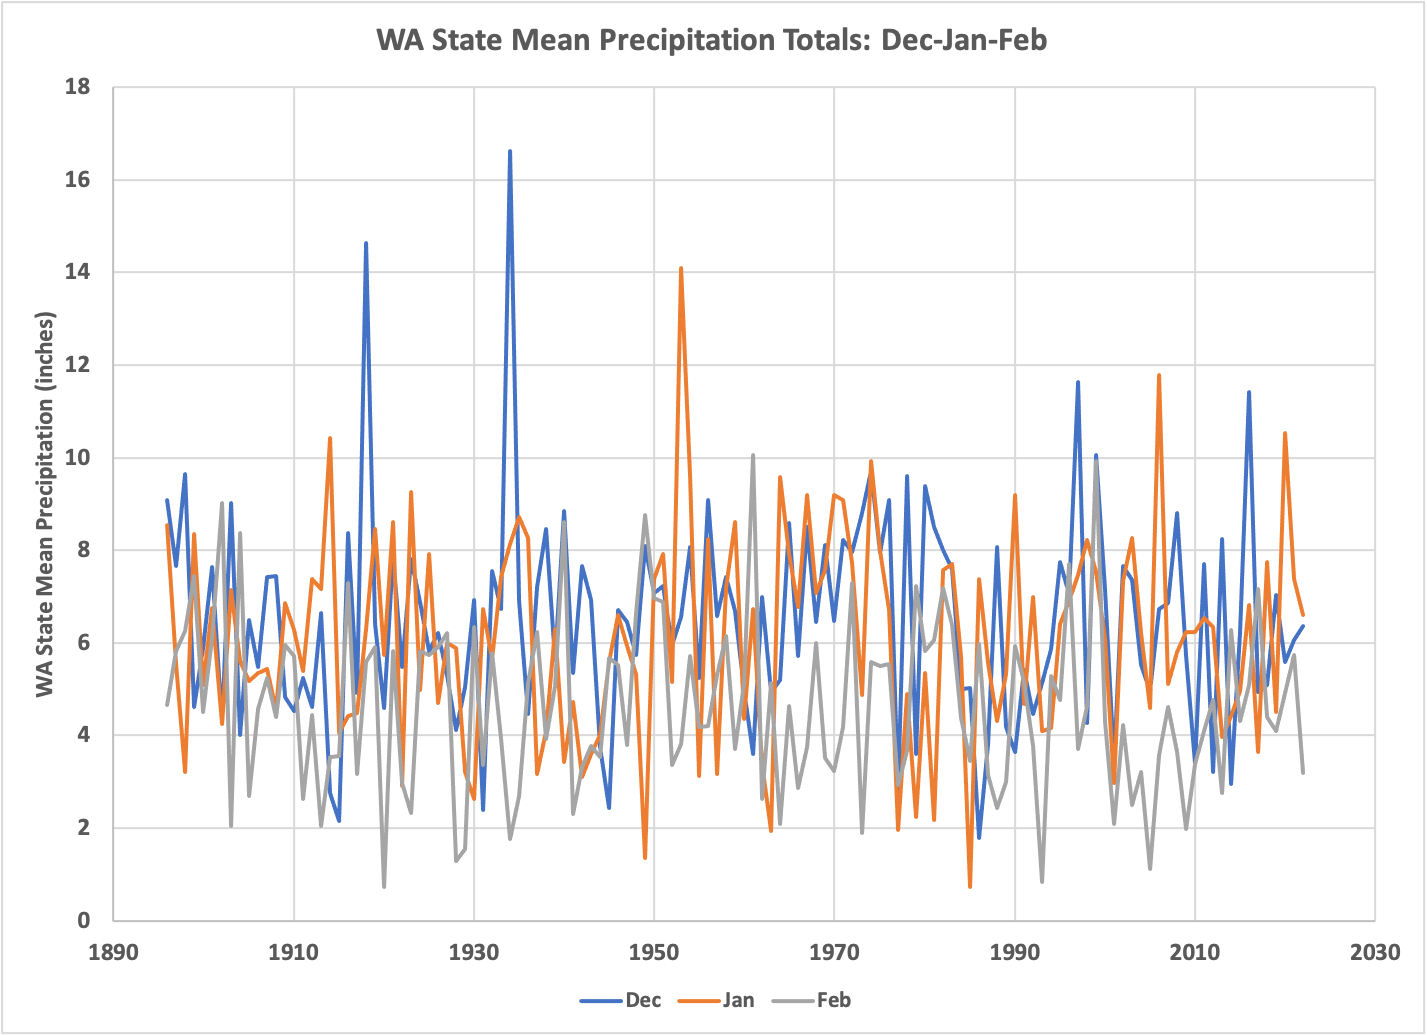 Figure 1: Total monthly precipitation averaged across Washington for December (blue), January (orange), and February (gray) from 1895 to 2022 (NCEI).
Here we consider precipitation amounts for the 10 climate divisions of WA state, and for brevity’s sake on winter total (December through February) amounts, again based on the historical record. The results of our analysis are summarized in Figure 2. This map includes the long-term average precipitation totals. We realize that most readers of this newsletter are familiar with the typical distribution of precipitation across WA, but babies are born every day that are not as aware of this spatial pattern, and so for completeness that information is included in Figure 2. This map also includes what are hopefully some additional perspectives of interest regarding winter precipitation: (1) the correlation between each climate division’s total and the statewide average total, and (2) for each climate division the range of total winter precipitation. The climate divisions on the west side of the Cascade Mountain crest (Divisions 1-5) correspond much more closely with the statewide average, which makes sense given the greater amount of precipitation on the west side. The climate division that is most representative of the state wide average is #4, the East Olympic Cascade Foothills division, with a correlation coefficient of 0.98 between its totals and the statewide averages. The climate division that is least representative is #8, the Central Basin division, with a correlation coefficient of 0.61. That climate division also represents the part of the state that is driest on average, and subject to greatest variability in winter precipitation relative to its mean totals. Winter total amounts in Division #8 have ranged from a meager 1.05” in the notably dry winter of 1976-77 for the US West as a whole, to an enviable 7.53” in the winter of 1939-40.
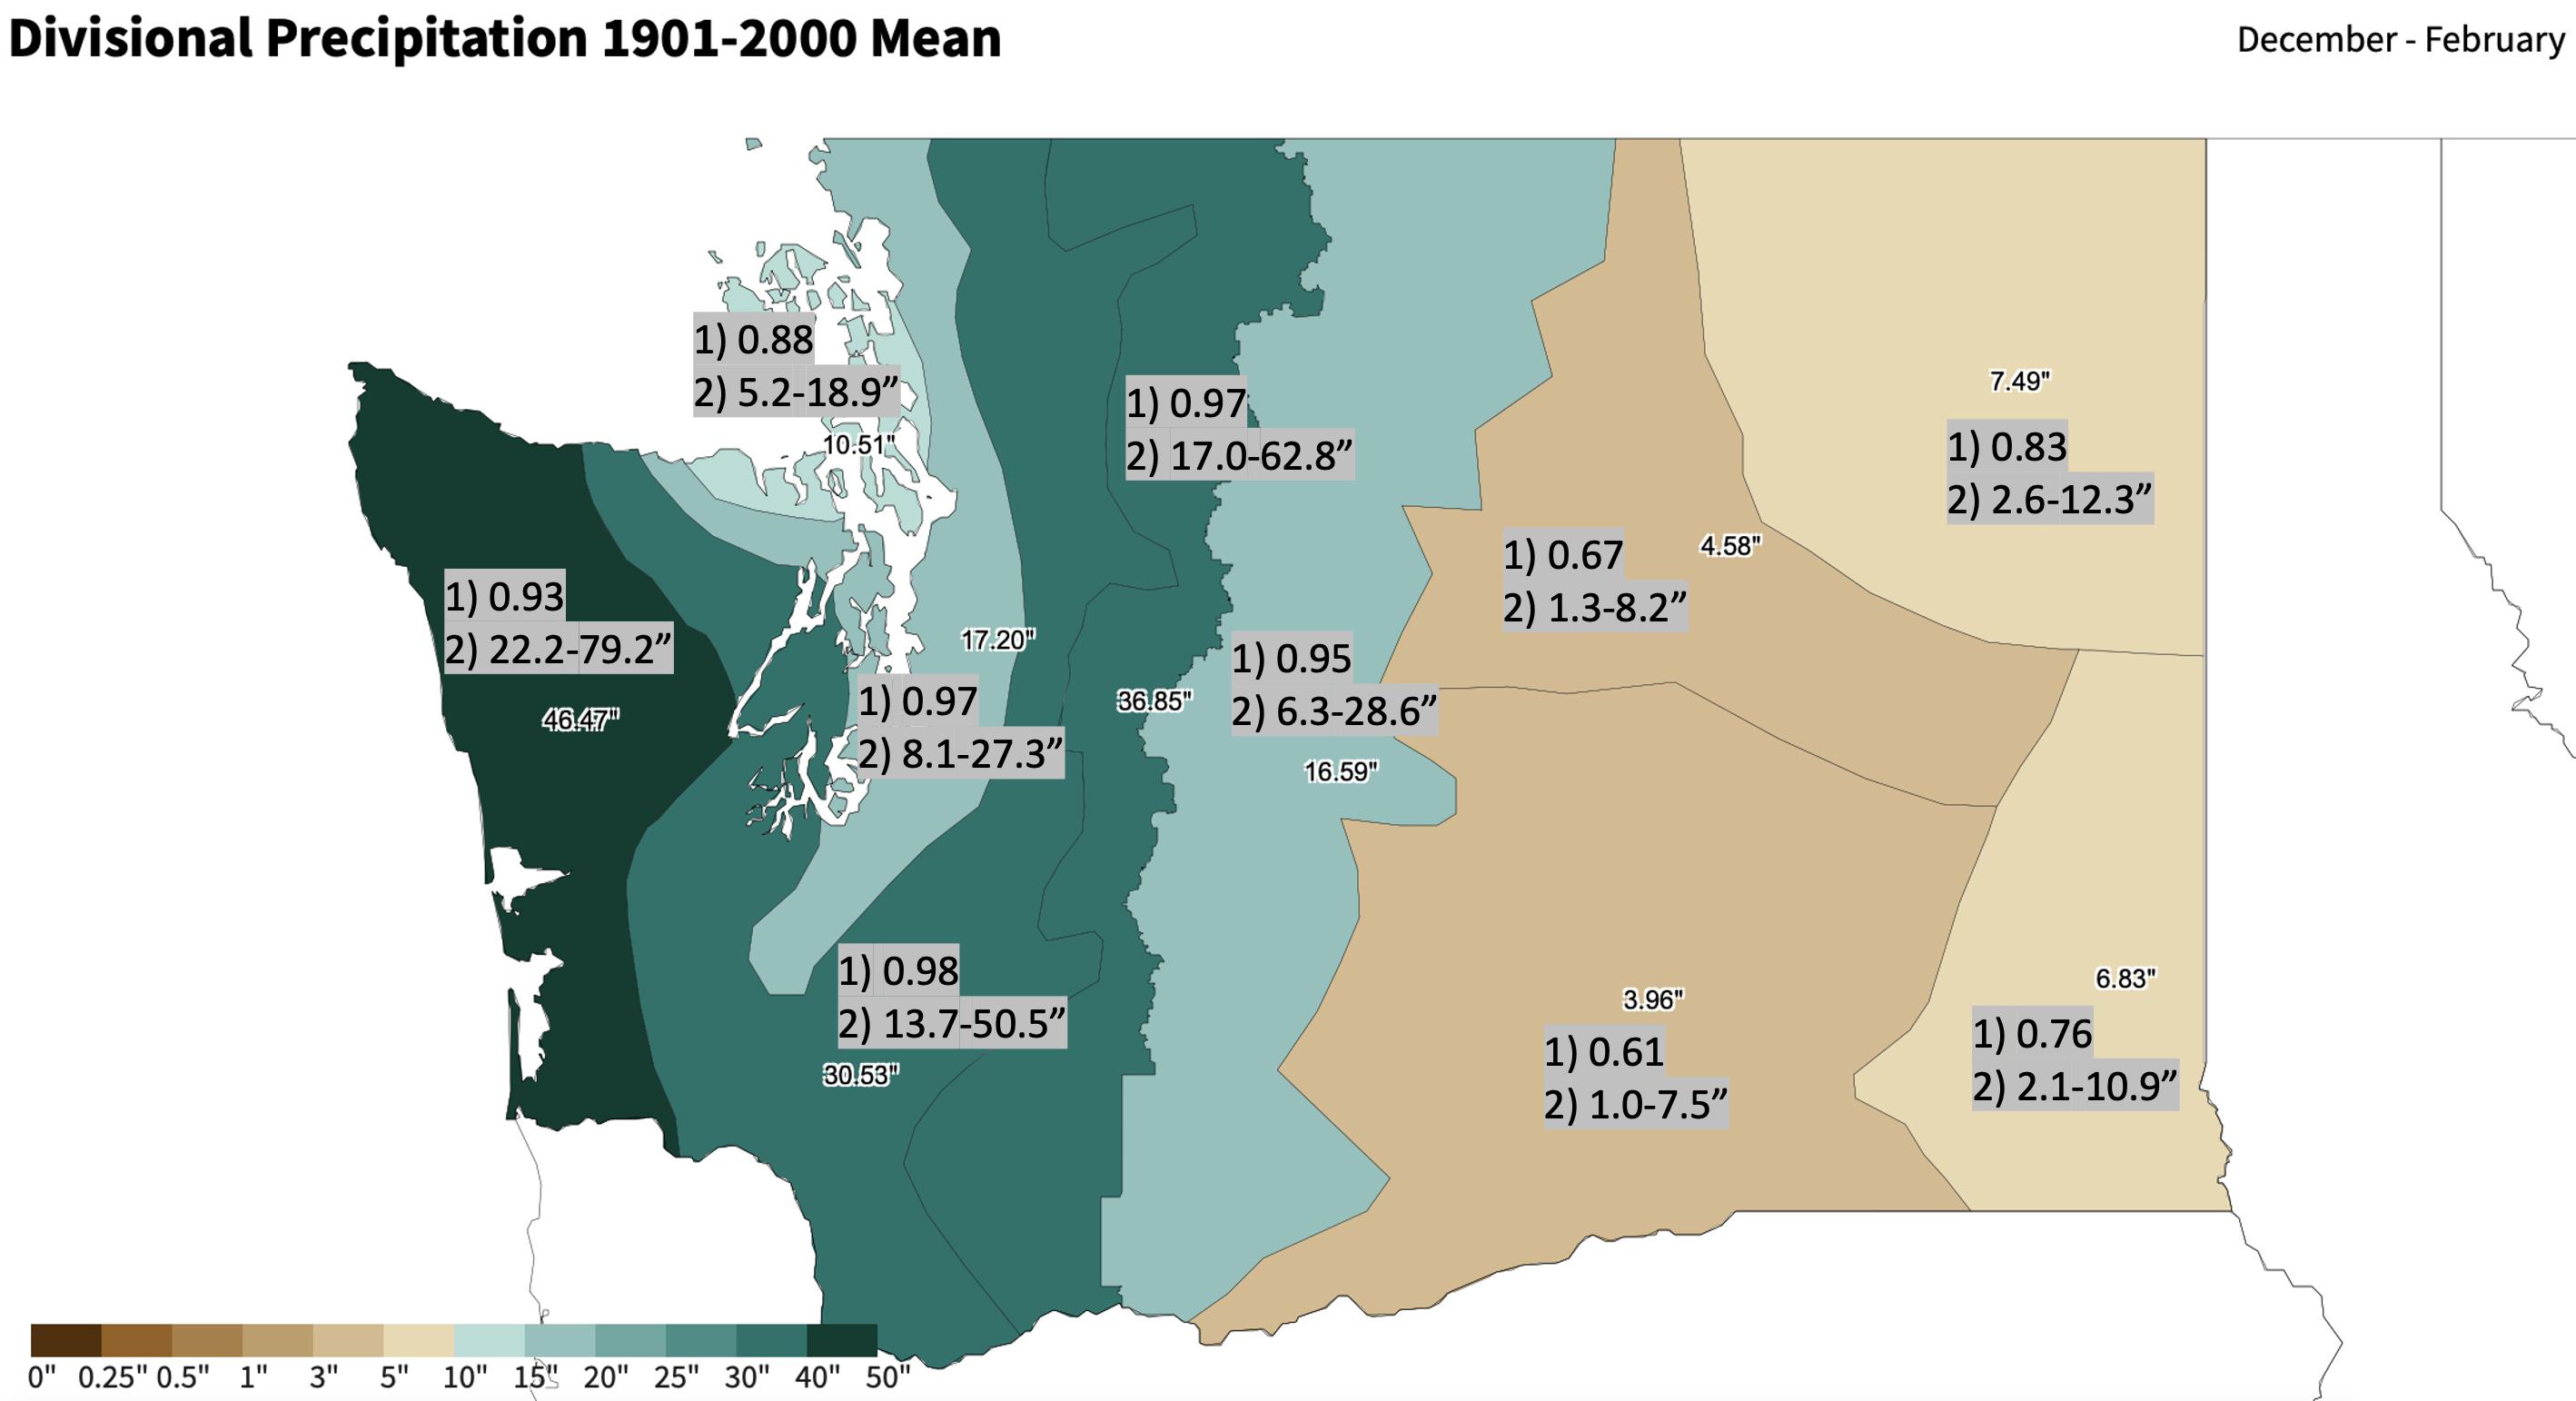 Figure 2: A map of longterm (1901-2000) December-February (DJF) average precipitation for each climate division with 1) the correlation between the DJF divisional precipitation and statewide precipitation and 2) the range of total DJF precipitation within each climate division from 1896 to 2022 (base map from NCEI).
We also computed the correlations between each of the 10 climate divisions with the others as another way to describe the co-variability in winter precipitation patterns. We spare you all the details here and instead mention a few tidbits. One interesting result was that the correspondence between most of the west side climate divisions and Division #9, the Northeastern division that includes the Spokane area, are greater than with east side divisions #7 an #8 that are closer in distance. We suspect that this result reflects the importance of the zonal component of the flow, with more westerly flow leading to not just greater amounts on the west side of the Cascade crest but also in the northeastern portion of WA state due to upslope flow on the western margin of the Rocky Mountains. But this factor is not simple, in that there is a strong correlation (0.94) between the winter totals for Division #5, the Cascade Mountains West, and Division #6, East Slope Cascades, despite their overall differences in sense of slope. Presumably the linkage here reflects spillover effects, i.e., wet periods for the west slopes also include enhanced precipitation for higher elevations east of the crest, even if amounts farther east in the foothills are minimal. Finally, the very lowest correlation coefficient of 0.33 is between Division #2, NE Olympic San Juan, and Division #8, Central Basin.
One upshot of our analysis may already be obvious but we are going to make it here anyway and that is the diversity of our climate and its variability. It is why WA has a relatively large number of climate divisions relative to its size, and also why we need to consider the spatial variability in our precipitation in assessing the presence of drought and water availability, which can vary so substantially across the state.