By Nick Bond
This piece represents a follow-on to previous work focusing on summer seasonal mean trends in potential evapotranspiration (pET) in eastern Washington state (Bond and Bumbaco 2015). Our primary objective is to show how yearly counts of high pET days have varied since the late 1980s. The pET metric used here is the Kimberly- Penman (1982) formulation that has two terms: a “heat function” term combining the effects of the net radiative heating and sensible heat flux in the soil, and a “wind function” term representing the transfer of water vapor from the surface to the atmosphere due to the wind. Our survey is based on daily pET values from the Odessa, LeGrow and Lind stations maintained by the US Bureau of Reclamation AgriMet Network. Odessa is in northern portion of the Columbia Basin in a drier location with less irrigation in its vicinity; LeGrow is near the confluence of the Snake and Columbia Rivers with generally higher atmospheric humidity; Lind is located between the other two stations but with conditions more similar to those at Odessa.
We kick things off with an update on the seasonal mean time series of pET for Odessa, LeGrow and Lind (Figure 1), which were three of the stations featured in Bond and Bumbaco (2015). Seasonal mean values of pET for the years of 2013-2022 – our previous study used data through 2014 – for Odessa featured substantially higher values than earlier in the record, with 2017 being an especially high pET year. Lind has had a similar trend with 2015 being the top year. For LeGrow, the warm summer of 2015 represented also the record mean pET to date, but the overall increase in pET here is much more modest.The instances of days with mean pET values at or above the arbitrary, yet relatively high, threshold of 0.45 inch at the three stations are shown in Figure 2, and we feel that the results are notable. There have been systematic if not monotonic increase in the number of drying (high pET) days over the last 20 years, and high pET days are almost completely absent before the turn of the century. Particularly extreme (>0.55 inch) days have occurred only during the past decade at Odessa and Lind; presumably they do not happen at LeGrow because of its greater humidity. It certainly can get hot in the Tri-Cities area.
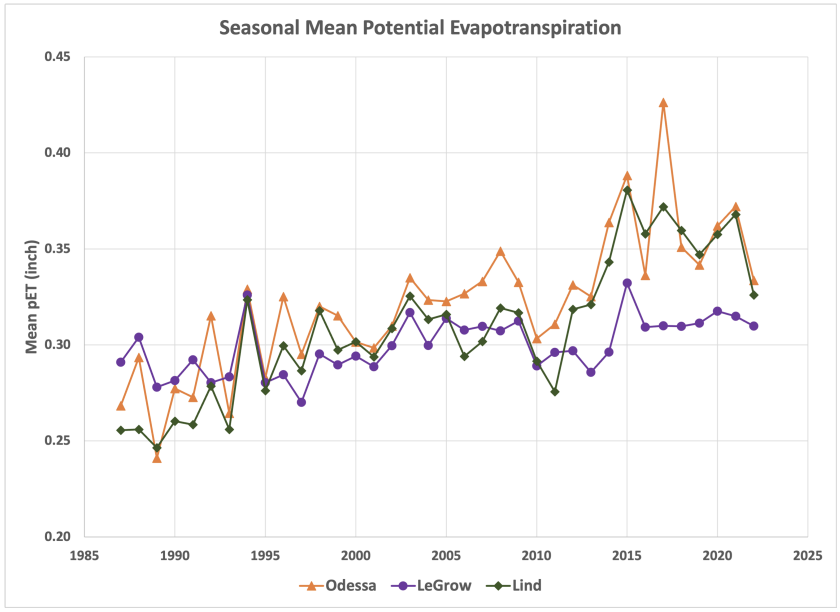 Figure 1: The summer mean pET from 1987 though 2022 for three stations in the AgriMet Network: Odessa (orange), LeGrow (purple), and Lind (green).
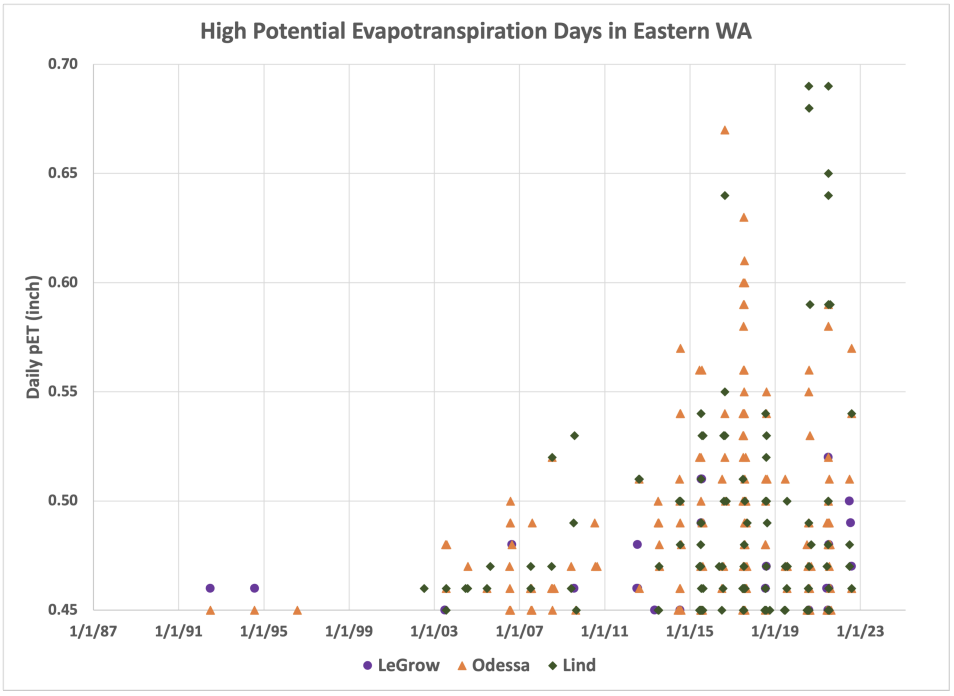 Figure 2: Summer days with mean pET above 0.45” at the three AgriMet stations from 1987 through 2022. Each column represents the high pET days in the summer following the date marker.
The maximum pET day at Odessa (0.67 in) occurred on 21 August 2016 when the maximum temperature was a hot but not blazing 93°F; the mean dewpoint was just below 30°F with brisk winds meaning the wind function term in the pET dominated. The daily mean pET reached 0.69 inch at Lind on 30 July 2020 and 28 June 2021, with 31 July 2020 checking in right behind with 0.68 inch. The 2020 event included maximum temperatures above 100°F, moderately strong winds, and dewpoints in the upper 40s, with the later event also including high maximum temperatures in association with the severe PNW heat wave of 2021. The pET at Lind was actually higher on the day before the greatest maximum temperature of 115°F because the mean winds were stronger (though not quite the magnitude as observed during the July 2020 event). The pET at LeGrow was surprising small during the heat wave of 2021 with a peak value of 0.52 inch on 30 June when the maximum temperature was 110°F. The mean dewpoint temperatures were 10-20°F higher than at the other two stations and the wind speeds were considerably lower. We speculate that the cooler daytime temperatures, and much greater dewpoint temperatures, at LeGrow reflect the local effects of irrigation. Establishing that would require further analysis outside of the present scope.
We are struck by the prevalence of high pET days in the recent part of the historical record and plan to look more into the subject. For example, it would be informative to compare the typical (and range of) conditions associated with high pET days versus heat waves in that the overlap between these kinds of summer events is not complete. Conceivably high pET events can adversely impact crops in WA state, especially in situations when water delivery systems cannot keep up with shorter-term demands. If any of the readers of this newsletter have some insights on this topic we would like to hear from you.
Reference
Bond, N.A. and K.A. Bumbaco (2015): Summertime Potential Evapotranspiration in Eastern Washington State, J. Applied Meteorology and Climatology, 54, 1090-1101.