By
The upcoming winter of 2023-24 will include El Niño in the tropical Pacific. The vast majority of the readers of this newsletter are aware that El Niño winters tend to be on the warm side, and often but not as consistently on the dry side, with important implications for our end-of-winter mountain snowpack. But we expect that our readers are less familiar with how El Niño impacts our day-to-day winter winds – and there is no shame there, in that we were also unsure the extent to which ENSO influences our winds. So we took a quick look.
Our approach has been to take advantage of cli-MATE application hosted by the Midwestern Regional Climate Center yet again, making use of its capability to produce wind roses for specified intervals. Wind roses represent a compact way to illustrate the frequencies of winds in various speed ranges over the entire compass of possible directions. We created wind roses for SeaTac Airport and Spokane International Airport based on the hourly reports for the months of November through March for the years of 1991 through 2020 to represent the climatology. We also created wind roses for these two locations separately for the last 4 moderately strong to strong El Niño winters, specifically 1997-98, 2002-03, 2009-10 and 2015-16. The idea here is to see if an ENSO signal is apparent in the data, and how much if any this expression varies among this handful of recent events.
Sets of wind roses for the 30-year climatologies, alongside those for the 4 El Niño winters separately, are shown for SeaTac and Spokane in Figures 1 and 2, respectively. Our overwhelming impression is that the winds during these El Niño winters were not much different from their climatological averages. Three out of the four El Niño winters considered here included a greater percentage of reports with calm winds than is typical at both SeaTac and Spokane, with the winter of 1997/98 representing an exception. SeaTac tends to have a bit more wind from the east-southeast (ESE) during these recent El Niño events, but that signal is slight. We were expecting a greater percentage of winds from the south during El Niño. The mean flow at 850 mb (~1.5 km) includes southerly wind anomalies of about 1 m s-1 over SeaTac during El Niño winters (not shown) – but that does not seem to be manifested in terms of the surface winds. Similarly, a weak at best signal was found for Spokane. The El Niño winters of 1997/98 and 2009/10 included more winds from the northeast and less frequent winds from the southwest than in the climatology, but that distinction did not occur in the other two winters. We would not have been surprised if the El Niño winters had included a bit more flow from the east since the mean sea level pressure anomaly pattern during those periods generally includes relatively low pressure over the Pacific versus the interior of the PNW. It is interesting that both locations rarely experience winds from the northwest in winter irrespective of El Niño. Perhaps this makes sense given the usual path of the low pressure centers moving in off the Pacific, which end up much more often in BC than Idaho.
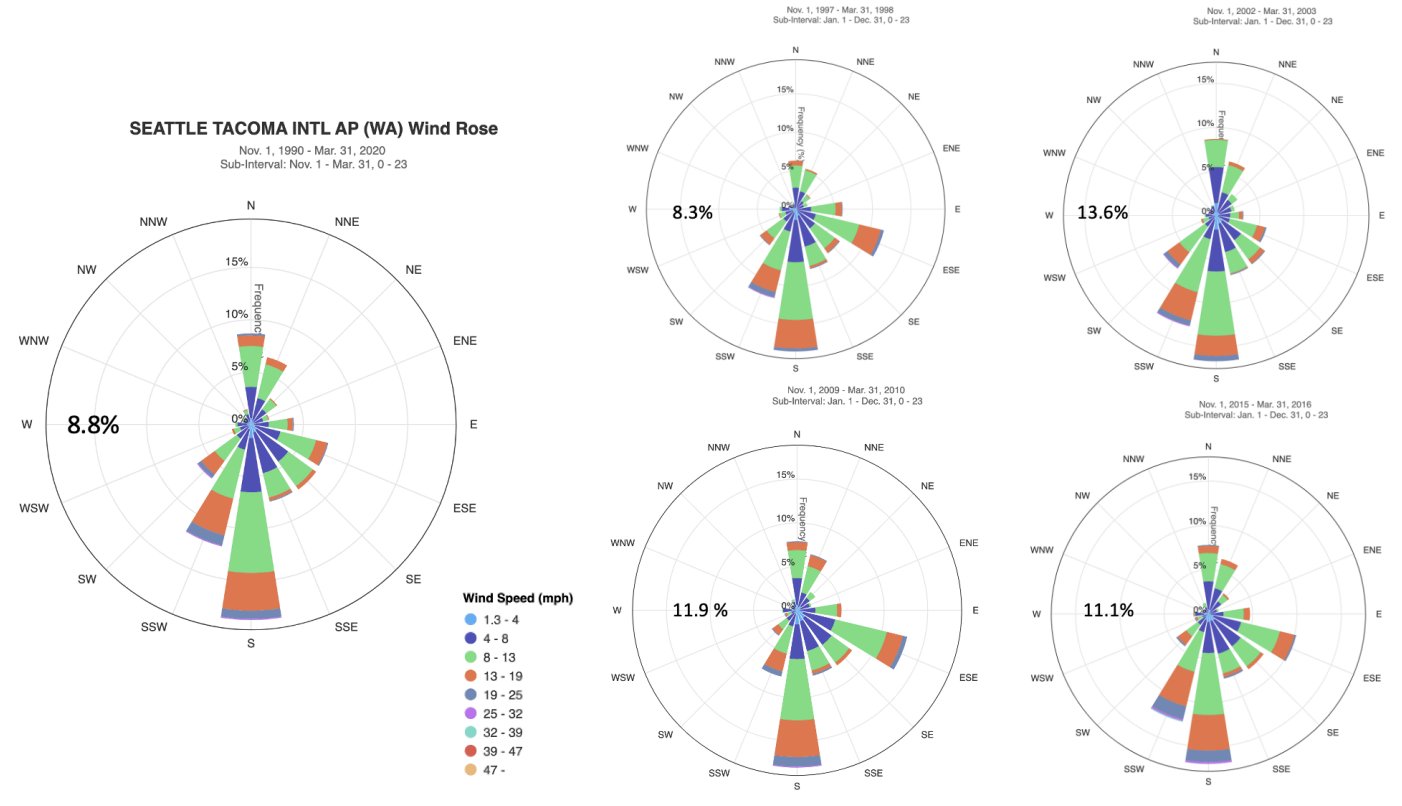 Figure 1: Wind roses for SeaTac Airport, with the 30-year climatology (1991-2020) of November through March winds on the left-hand side, and individual wind roses for four El Niño winters on the right. The winters are 1997-98 (top left), 2002-03 (top right), 2009-2010 (bottom left), and 2015-16 (bottom right). The percentages on the left of each wind rose are the percentage of calm winds for the climatology and winter, respectively (cli-MATE).
 Figure 2: As in Figure 1, except for Spokane International Airport.
While these results on the effects of El Niño are rather unimpressive, we thought our readers might be interested in another type of comparison using wind roses, and that is an example of small-scale spatial variations in the winds. Towards that end, we also created a climatological (1991-2020) winter wind rose for Boeing Field in Seattle. The two airports are separated by only about 5 miles. But SeaTac is situated on a bluff between the Green River and Puget Sound while Boeing Field is nestled in the Green/Duwamish River valley with the higher terrain of Beacon Hill immediately to its east, and a spine of higher elevations from West Seattle to White Center also to its west. In other words, Boeing Field might be expected to be prone to more channeling than SeaTac. As illustrated in Figure 3, that is indeed the case, with the wind rose for Boeing Field featuring a strong tendency for wind directions between out of the south and out of the southeast. With the prevalence for an east component to the winds, it makes sense that the runways at Boeing Field are oriented along 140/320 degrees while their counterparts at SeaTac are oriented along 160/340 degrees. An intriguing factoid here is that runway orientations are referenced to magnetic north to the nearest 10 degrees rather than true north, perhaps more due to tradition than modern navigation systems. Presently magnetic north is about 15 degrees to the right of true north in the local area. The location of the magnetic north pole has been moving about 40 miles a year, and it has shifted far enough that Boeing Field’s runways transitioned from 130/310 to their present designations in 2017. And according to an article by Dominic Gates of the Seattle Times, old photos of Boeing Field show markings for runways oriented along 120/300 degrees. We encourage our readers to take advantage of this information on the change in Boeing Field runway orientation…it seems like the right kind of fodder for a bar bet…
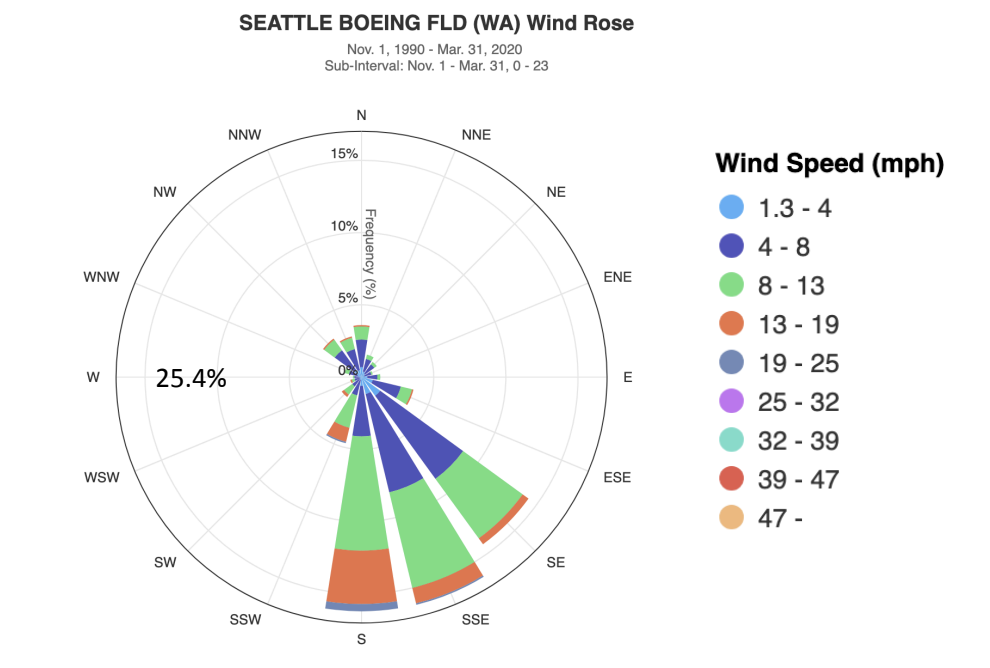 Figure 3: The wind rose Nov-March climatology (1991-2020) for Boeing Field (cli-MATE).