By Nick Bond
The U.S. Department of Agriculture (USDA) recently released a new plant hardiness zone map (PHZM). The zones are based on the average annual extreme minimum temperature during the years of 1991 through 2020. Importantly, they donot reflect all-time minimum temperatures but rather the coldest temperatures that can be expected during a typical year based on the recent climate. This represents an important aspect of a location’s microclimate, of course, and is widely used towards the selection of perennial plants. The material that follows includes comparison with the previous version of the PHZM released in 2012.
PHZM was produced using the Parameter- elevation Relationships on Independent Slopes Model (PRISM) interpolation method developed at Oregon State University. PRISM combines station data from a variety of networks with multiple factors related to the terrain to estimate daily maximum and minimum temperatures, among other weather variables; for the PHZM application this procedure was carried out on a grid with cells about one-half mile on a side. For high elevations, temperatures from atmospheric reanalyses were also incorporated. The new version also better accounts for the effects of nearby bodies of water. The map itself includes zones at 5 degree increments, as shown in the recent released (Figure 1) and the 2012 version (Figure 2).
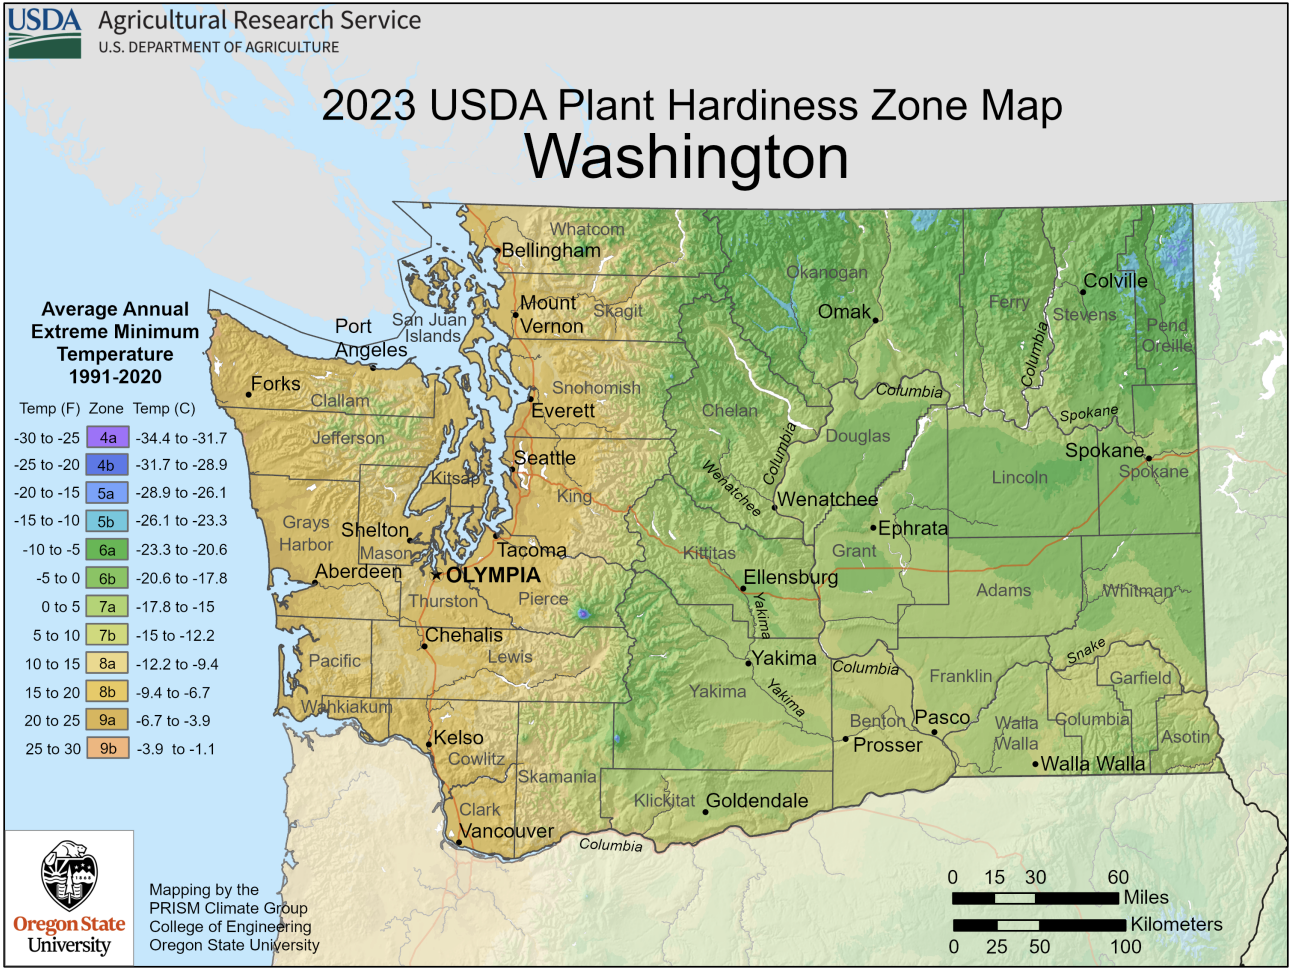 Figure 1: 2023 USDA plant hardiness zone map. Explore online here.
 Figure 2: 2012 USDA plant hardiness zone map. Explore online here.
As far as we can tell, there is not a publicly- available map that illustrates the differences between the two versions. But at least the color scales are consistent, so by inspection some general conclusions can be made about how extreme minimum temperatures have changed in WA state. In some parts of the state, but by no means all, there have been increases by one 5°F category. For example, near the border with Canada in eastern WA, there is much less blue, signifying temperatures in the 5a and 5b categories, in the latest as compared with the 2012 version. For the southern portion of eastern WA, there are now areas in the 7b category (annual extremes down to 5-10°F), whereas the older version had the entire east side in the 7a category and lower. In general, the changes appear more prominent on the east side as compared with the west side of the Cascade Mountains, as expected given the former’s more continental climate and for that matter, the results from climate model simulations. That being said, there are also some changes on the west side, with a greater proportion of the lowlands surrounding Puget Sound in the 8b category, with typical annual extremes in the 15-20°F range. And along the Pacific coast there appears to be a narrow band in the 9a category that was lacking before (the color scale here does one no favors).
A complementary perspective on annual extreme temperatures is afforded through consideration of time series from selected stations. Here we consider the records from three west side (Hoquiam, Olympia and SeaTac) and three east side (Yakima, Ritzville and Spokane) stations for the last 50 years. On the west side, the interior but more rural station of Olympia has had a greater overall increase in this metric versus the coastal station of Hoquiam and the more urban location that is SeaTac (Figure 3). On the east side, Spokane has had its extreme minimum temperatures increase to a greater extent than Yakima and Ritzville (Figure 4). Spokane International Airport is not in an area that is undergone extensive development in recent decades, but it is west of the core of the Spokane urban area, and since the coldest weather occurs with overall low-level flow with an easterly component, it is possible that urban heat island effects have played a role. We find it interesting that the interannual fluctuations in extreme minimum temperatures among the three stations on the west side mostly track each other, and that the three stations on the east side are even more in lockstep, but the correspondences between the west side and east side extremes are weaker. For example, the year of 1996 included quite low extremes for the three locations examined in eastern WA, but was not unusual for the westside locations. There are other years when the west side had some very cold weather, such as 2009, with less unusual results for eastern WA. There are counter examples to be sure; all stations report quite cold minimums in 1990. All that being said, we present these time series in part to emphasize how quite cold temperatures can still occur in WA state, but not as frequently and not to the same extremes.
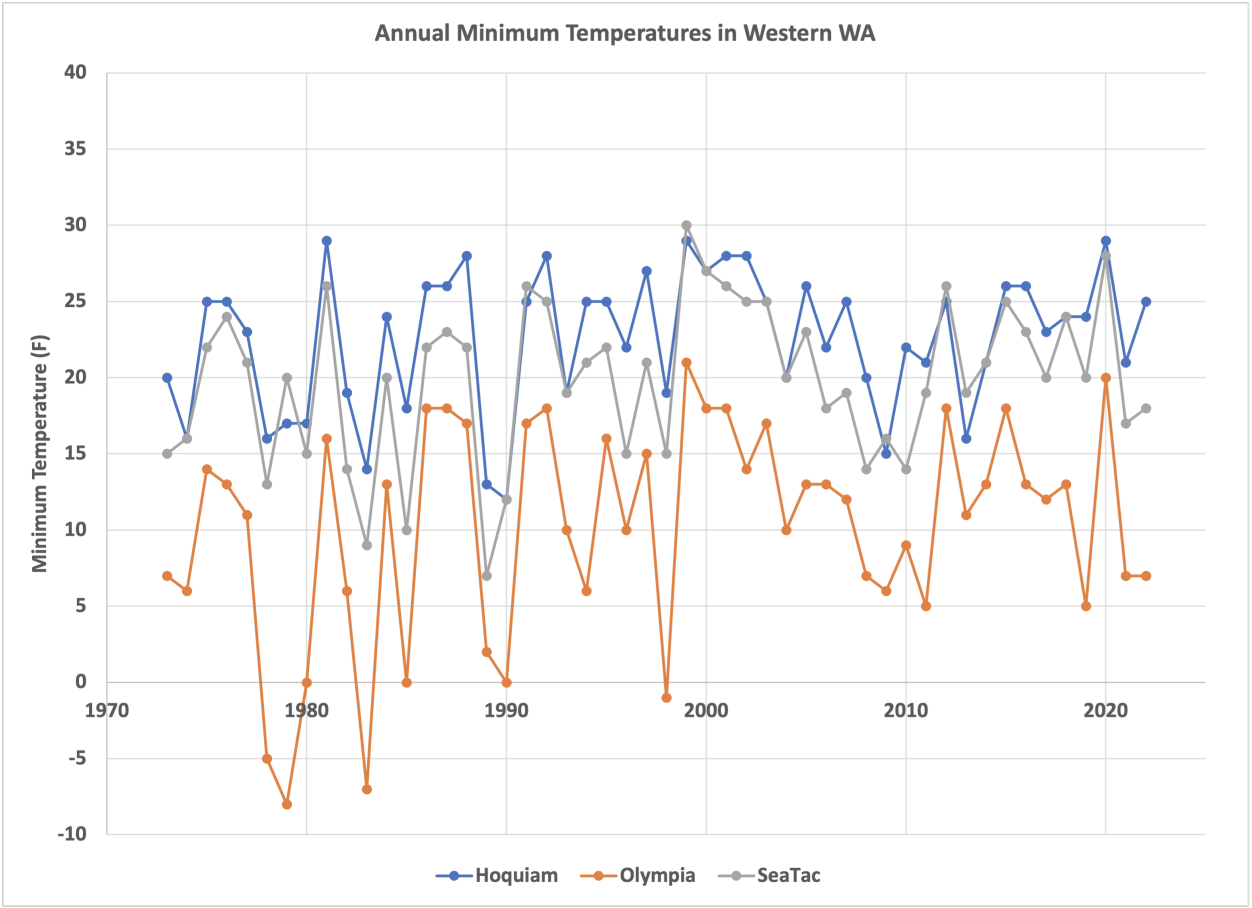 Figure 3: The coldest minimum temperature for each year from 1973-2022 for three stations in western WA (Hoquiam, Olympia, and SeaTac).
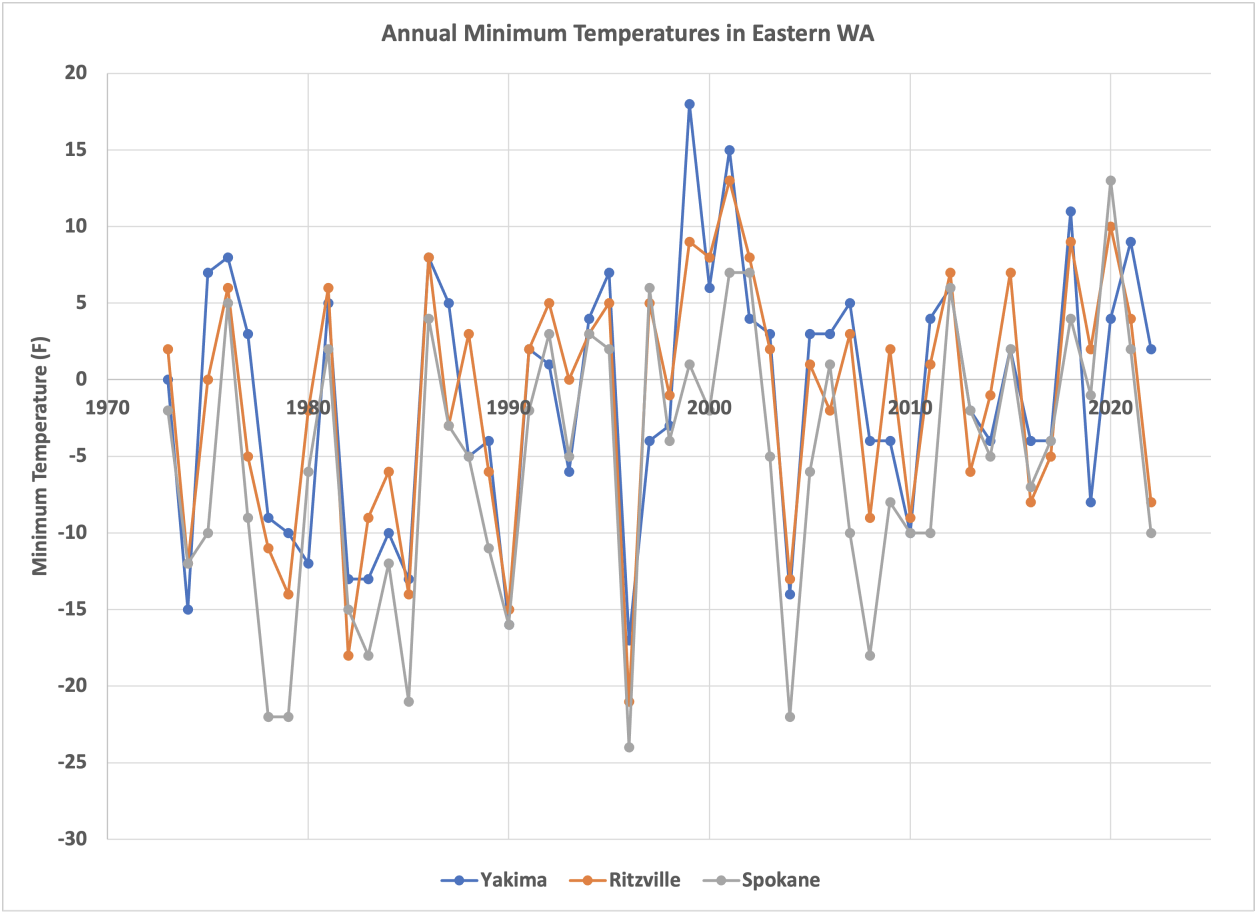 Figure 4: As in Figure 3, except for three stations in eastern WA (Yakima, Ritzville, and Spokane).
We close with the thought that while extreme minimum temperatures represent an important element of the winter climate, there are plenty of other variables that matter. It is beyond the scope of the present piece, but how have maximum winter temperatures varied over the record? How close are extreme minimum temperatures tied to mean winter temperatures? Perhaps we will be able to address these questions in future newsletters.