By Nick Bond
As discussed above in this edition of our newsletter, the last week of February into March of 2024 featured some substantial snowfall in the mountains of Washington state. It has been heartening to watch the recent improvement in the snowpack – which can be thought of as out of the intensive care unit but not fully healed – and towards that end we have been making use of a relatively new application hosted by the Natural Resources Conservation Service (NRCS) of the U.S. Department of Agriculture. More specifically, we are referring to the Snow and Water Interactive Map (iMAP). This application has a variety of goodies, as shown in an example below.
The iMAP application makes it convenient to focus on a particular region of interest, with controls to examine different parameters related to precipitation and water supply from either station or basin perspectives. The parameters available include snow water equivalent (SWE), snow depth and density, precipitation, soil moisture and temperature, reservoir storage, and observed and forecast streamflow. What more do you want? There is also a great deal of flexibility in how these parameters are compared with climatological norms, and how they have changed with time during the periods of record. Time series generated with the application are easy to download for further analysis.
Here we use iMAP to contrast the change in SWE across WA state that has occurred during the warm and dry March of 1992 (Figure 1) versus its cool and wet counterpart during March of 2012 (Figure 2). These two periods represent bookends for what can happen to our snowpack during March. From a statewide perspective, March of 1992 was 5.4°F warmer than normal (using the 1991-2020 baseline) and the total precipitation was 3.56” below normal, representing the 2nd driest March on record. While there is usually growth in SWE in our mountains during the month of March, except for at lower elevations, the warmth and meager precipitation of March 1992 was bad news for the snowpack. Figure 1 shows that there were some locations that more or less broke even, but substantial losses were widespread, with some locations in the southern Cascades of WA state experiencing declines in SWE exceeding 8”. March of 2012 was a different story due to its temperature anomaly of -2.1°F and statewide average precipitation totaling 3.22” greater than normal. There have been other March months in the last couple of decades with colder temperatures, but 2012 stands out for being both cold and wet. Not surprisingly, there was major growth in the SWE in our mountains during March 2012 (Figure 2), with many stations recording increases greater than 12”. Figures 1 and 2 are just screen grabs; the application itself lets one easily check out other properties at individual locations by clicking on a station. OWSC closely monitors the evolution of the snowpack in the Pacific Northwest, especially during the present time of year. We are grateful that that is so easy to do, thanks to iMAP.
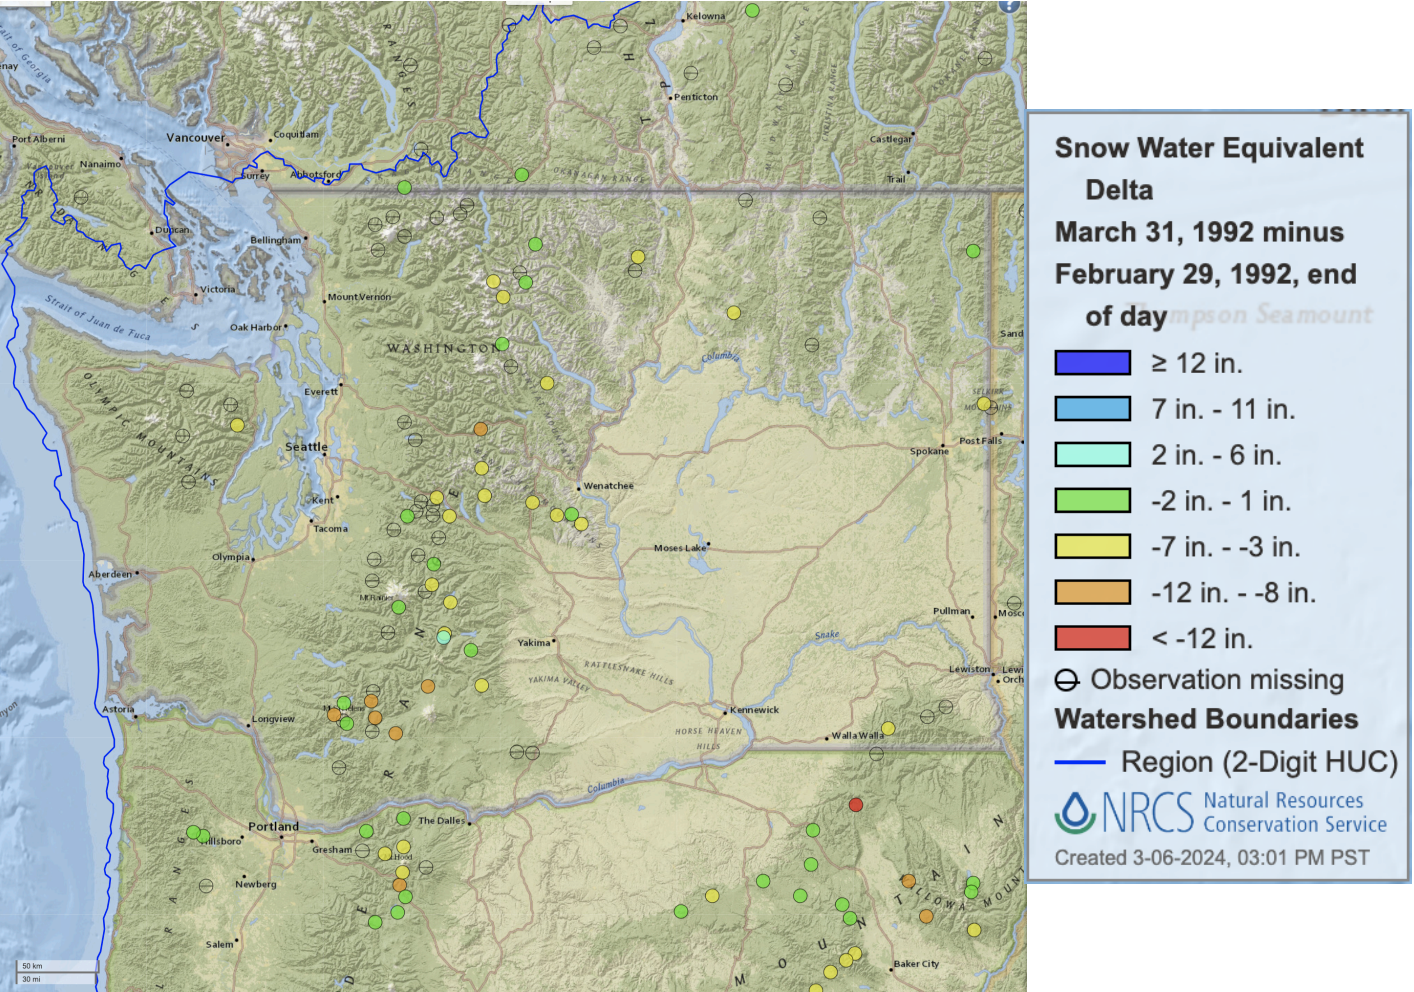 Figure 1: Change in snow water equivalent (inches) relative to climatological median values (1991-2020) during March 1992 (NRCS).
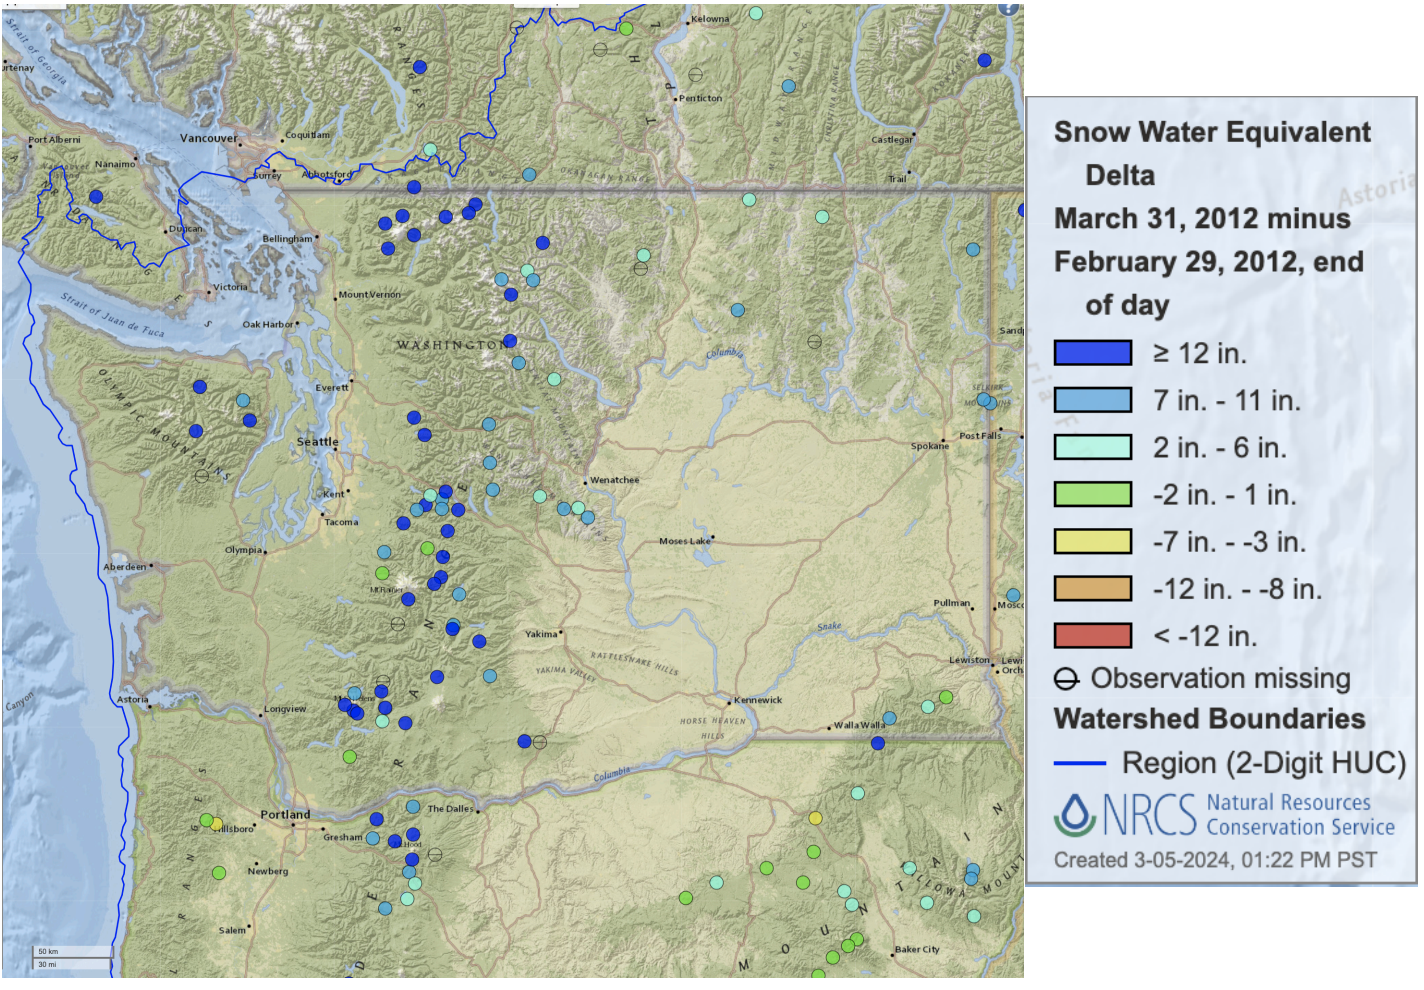 Figure 2: As in Figure 1, except for March 2012.