The fourth Pacific Northwest (PNW) Water Year Impacts Assessment, released in March, is a collaborative effort between water managers and scientists at the Office of the Washington State Climatologist, the Climate Impacts Group, Oregon Climate Service, Idaho Department of Water Resources, and the NOAA National Integrated Drought Information System (NIDIS). As reviewed in this newsletter before, the assessment is a culmination of several activities during the water year which include water year meetings and an end-of-the-water-year impacts survey. For the first time, an abbreviated version of the assessment is available in Spanish (Figure 1). The assessment summarizes the variations in temperature, precipitation and snowpack across Washington, Oregon, and Idaho during the 2023 water year (October 1, 2022-September 30, 2023) and reports on different sector-specific impacts that those caused. Here, we highlight just a few of the main findings.
Averaged over the water year, and for the PNW, temperatures were near the 1991-2020 normal and total precipitation was only slightly below normal. But examining the regional averages masks both the spatial variability and the seasonal variability throughout the water year. In general, the northwestern portions of the PNW, including Washington, were drier than normal, which aligned with the areas of worsening drought. But the biggest determinant of that worsening drought was the rapid melt of a normal snowpack caused by much above normal temperatures in May 2023. May was the warmest ever in Washington state over the 129-year record.
Various impacts were reported throughout the PNW in response to 2023 water year conditions. For example, drinking water, agriculture, forestry, fisheries, and hydropower were all affected by abnormally dry conditions. The assessment features a call-out box in Seattle City Light hydropower impacts. In addition, there were various voluntary, and even some mandatory, water restrictions. The assessment provides more details by sector; a sample summary of the impacts for drinking water is shown in Figure 2.
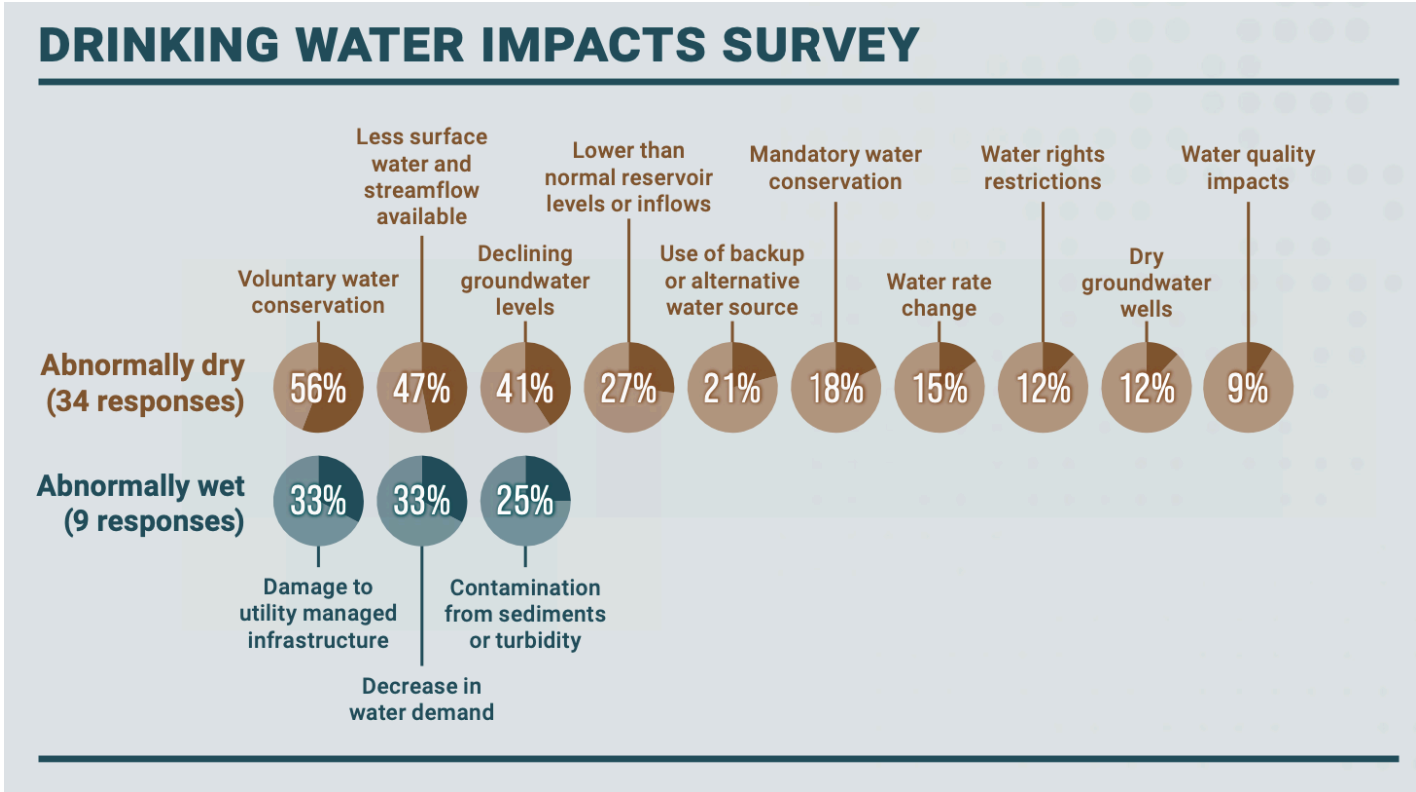 Figure 2: The PNW survey responses from the drinking water sector to a series of questions about abnormally dry or abnormally wet conditions during the 2023 water year (2023 assessment).
Overall lessons learned from the water year are also provided in the report. The 2023 water year was an example how temperature can be the primary driver of water supply variations. The seasonal temperature anomalies had a greater effect than precipitation on water supply during two key portions of the water year: the below normal temperatures from February through April and much above normal temperatures in May. The colder than usual Feb-Apr ensured that precipitation fell as snow in the high elevations, building a decent snowpack in Washington despite drier than normal conditions. And, as mentioned above, the warmer than usual May caused snowpack to melt rapidly thus altering the water supply situation. In short, it’s not all about precipitation.
We hope we included enough of a teaser of what’s in the assessment to encourage you to take a closer look. We also invite you to participate in this process of documenting impacts as we are planning to write a fifth assessment for the 2024 water year. In the fall, we will provide more opportunities for water managers, agricultural producers and others to provide their insights into how drought and seasonal climate conditions impacted them. The annual water year survey is typically distributed in early October, and the water year meeting is held in November.