By Nick Bond
Jack Barth and collaborators have published a recent journal article entitled “Widespread and increasing near-bottom hypoxia in the coastal ocean off the United State Pacific Northwest”. This article shows that ocean oxygen concentrations have tended to decline over the historical record, with the summer of 2021 in particular featuring large areas with values low enough to be harmful to many marine animals. It relates the changes in ocean chemistry to increases in upwelling-favorable winds in the summertime and hypothesizes that these increases may be attributable to climate change. Their analysis of the winds focused on Newport, Oregon, which is located on the central Oregon coast. We feel that it is worthwhile here to take a look at what the data show for the summertime winds along the Washington coast.
The present treatment relies on three sources of information. The first source is hourly wind data from a C-MAN station on Destruction Island at 47.68°N, 124.48°W, about 6 kilometers off the coast of Washington near Ruby Beach. These data are used to specify the frequency of upwelling-favorable winds during the years of 1985 through 2023, for the peak summer period of July and August, and separately the longer season of June through September. Periods of upwelling are defined as those with wind directions ranging from 310 degrees to 30 degrees, i.e., out of between the northwest and north-northeast, and wind speeds of 3 meters/sec (6.7 mph) and greater. The frequency of these conditions during July and August, and June through September are considered here. The second type of data used here are monthly values of the coastal upwelling transport index (CUTI) as provided by the Environmental Research Data Services of NOAA’s Southwest Fisheries Science Center. CUTI estimates vertical transports at the base of the upper ocean mixed layer based on a combination of the surface wind stress, sea surface height and upper ocean mixed layer depth, with the alongshore winds being responsible for most of the variability. Here we focus on CUTI estimates for the months of July and August, at the latitude of 47°N. Third, we created wind roses from Quillayute for the months of June through September for two 20-year periods, namely 1966-1985 and 2004-2023, which represent the earliest and latest 20-year periods available through the cli-MATE application hosted by the Midwestern Regional Climate Center (MRCC).
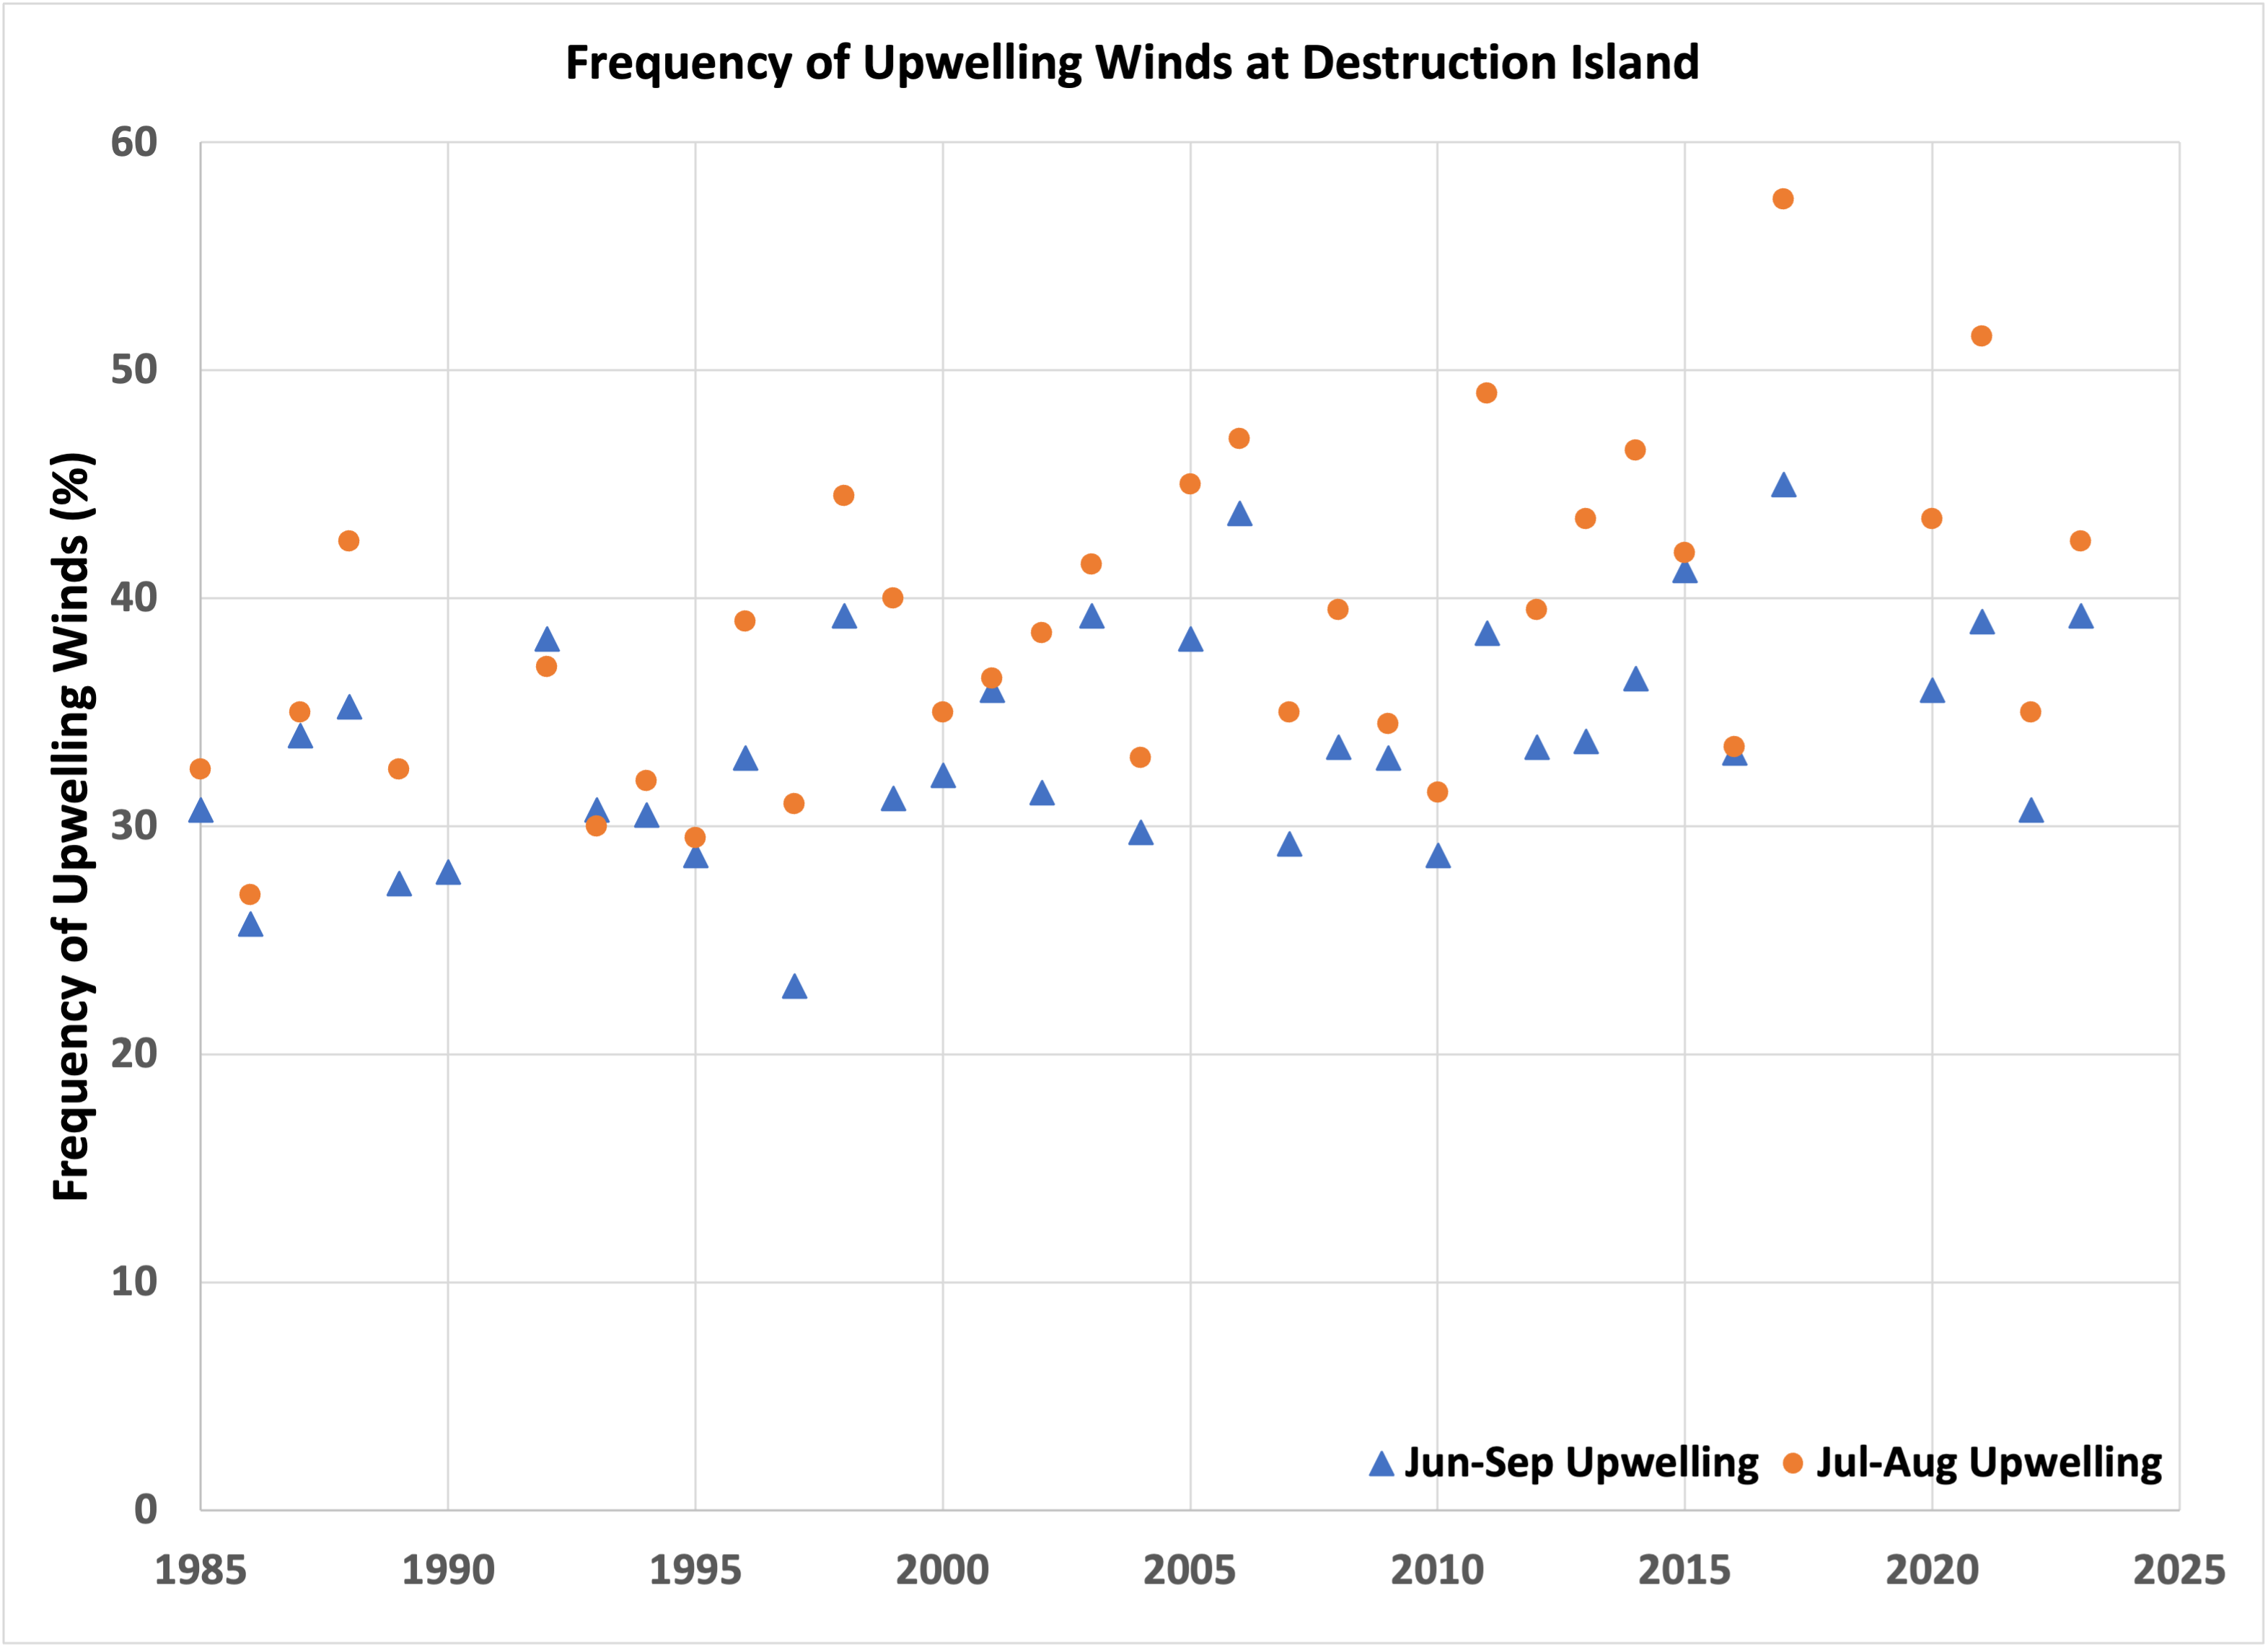 Figure 1a: The frequency of upwelling winds (%) at Destruction Island for June-August (blue triangles) and July-August (orange circles) from 1985 to 2023.
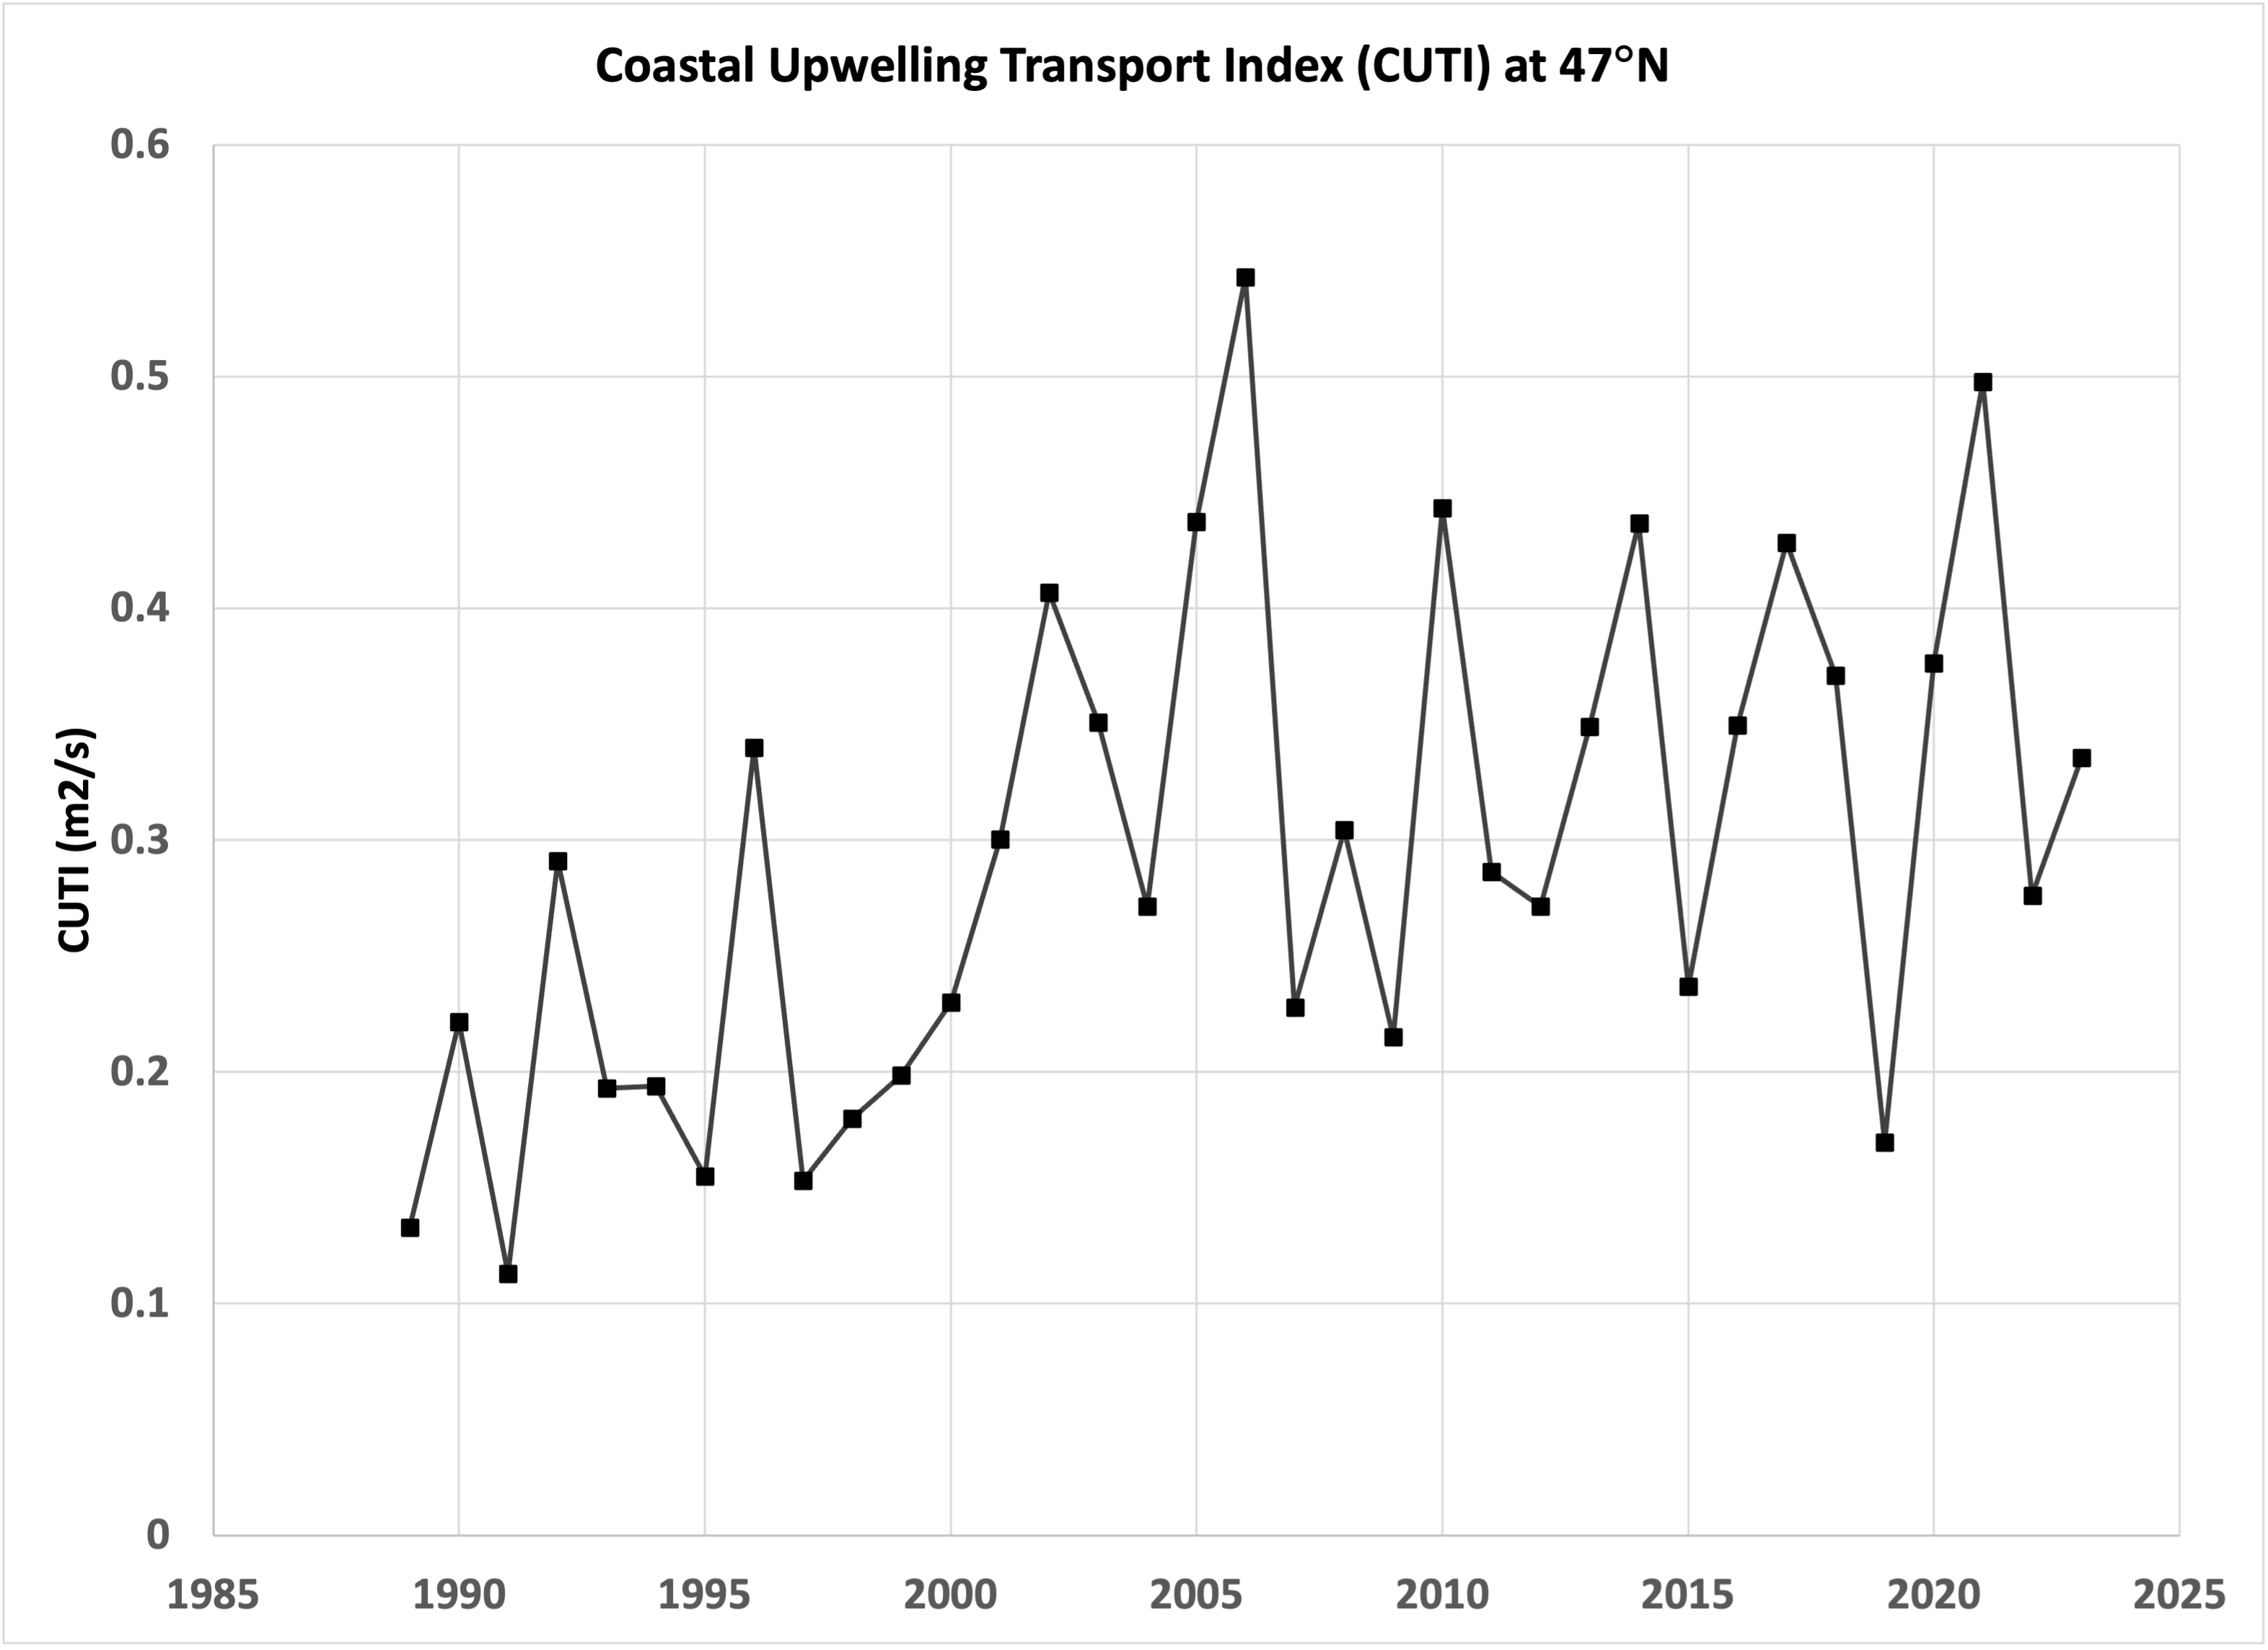 Figure 1b: The July-August Coastal Upwelling Transport Index (CUTI) at 47°N.
Time series of the frequency of upwelling winds at Destruction Island, and CUTI at 47°N, are shown in Figures 1a and 1b, respectively. The frequency of upwelling winds, as defined here, during the two-month period of July and August is almost always higher than that for the four-month period of June through September, with the years of 1992 and 1993 being minor exceptions. There was an overall increase in the frequency of upwelling winds from the mid-1980s to the early to mid-2000s at Destruction Island. But in the last two decades or so, the trends are small relative to the year-to-year variability. The results based on the winds at Destruction Island are mostly consistent with the time series of CUTI at 47°N. The latter time series features a greater relative increase from values near 0.2 m2/s before 2000 to values averaging a bit more than 0.3 m2/s after the early 2000s. Since then, the overall trend in CUTI is negligible. There is a positive correspondence between the frequency of upwelling winds at Destruction Island and CUTI at 47°N but these two measures are by no means in lockstep. The linear correlation coefficient between the July-August upwelling and CUTI is about 0.62. That the two measures differ makes sense, in that CUTI includes information related to oceanographic conditions, and a more complete perspective on the winds. This last point is elaborated upon using the wind roses for Quillayute.
Wind roses for the months of June through September for the years of 1965 through 1984, and 2004 through 2023, are shown in Figures 2a and 2b, respectively. While Quillayute is a few miles inland from the coast, we expect that its wind directions are representative of what occurs over the nearby coastal waters (the speeds at Quillayute will generally be lower than over the ocean due to greater surface roughness over land). With regards to the frequency of upwelling winds in summer, again here considered to be for winds blowing from between the northwest and north-northeast, was about 20% during the years of 1966 through 1985 and 15% during the years of 2004 through 2023. There has been a noticeable decrease in summer downwelling favorable winds; note that the frequency of southerly winds in the earlier record is about double that of the later record. Periods of southerly winds are reflected in CUTI, and have important implications for the marine ecosystems. Southerly winds result in onshore-directed Ekman transports of planktonic (free-floating) organisms towards the coast and downward transport of near surface waters with higher oxygen concentrations, and relief from hypoxic conditions at depth.
Our findings suggest that over the last couple of decades, summer upwelling has not really increased along the central-northern Washington coast in the vicinity of the locations of the records reviewed here. There does appear to be less downwelling now than in the past, but these results are tentative at best. How do our results square with the projections from global climate models? That may be a fruitful line of inquiry for a future edition.
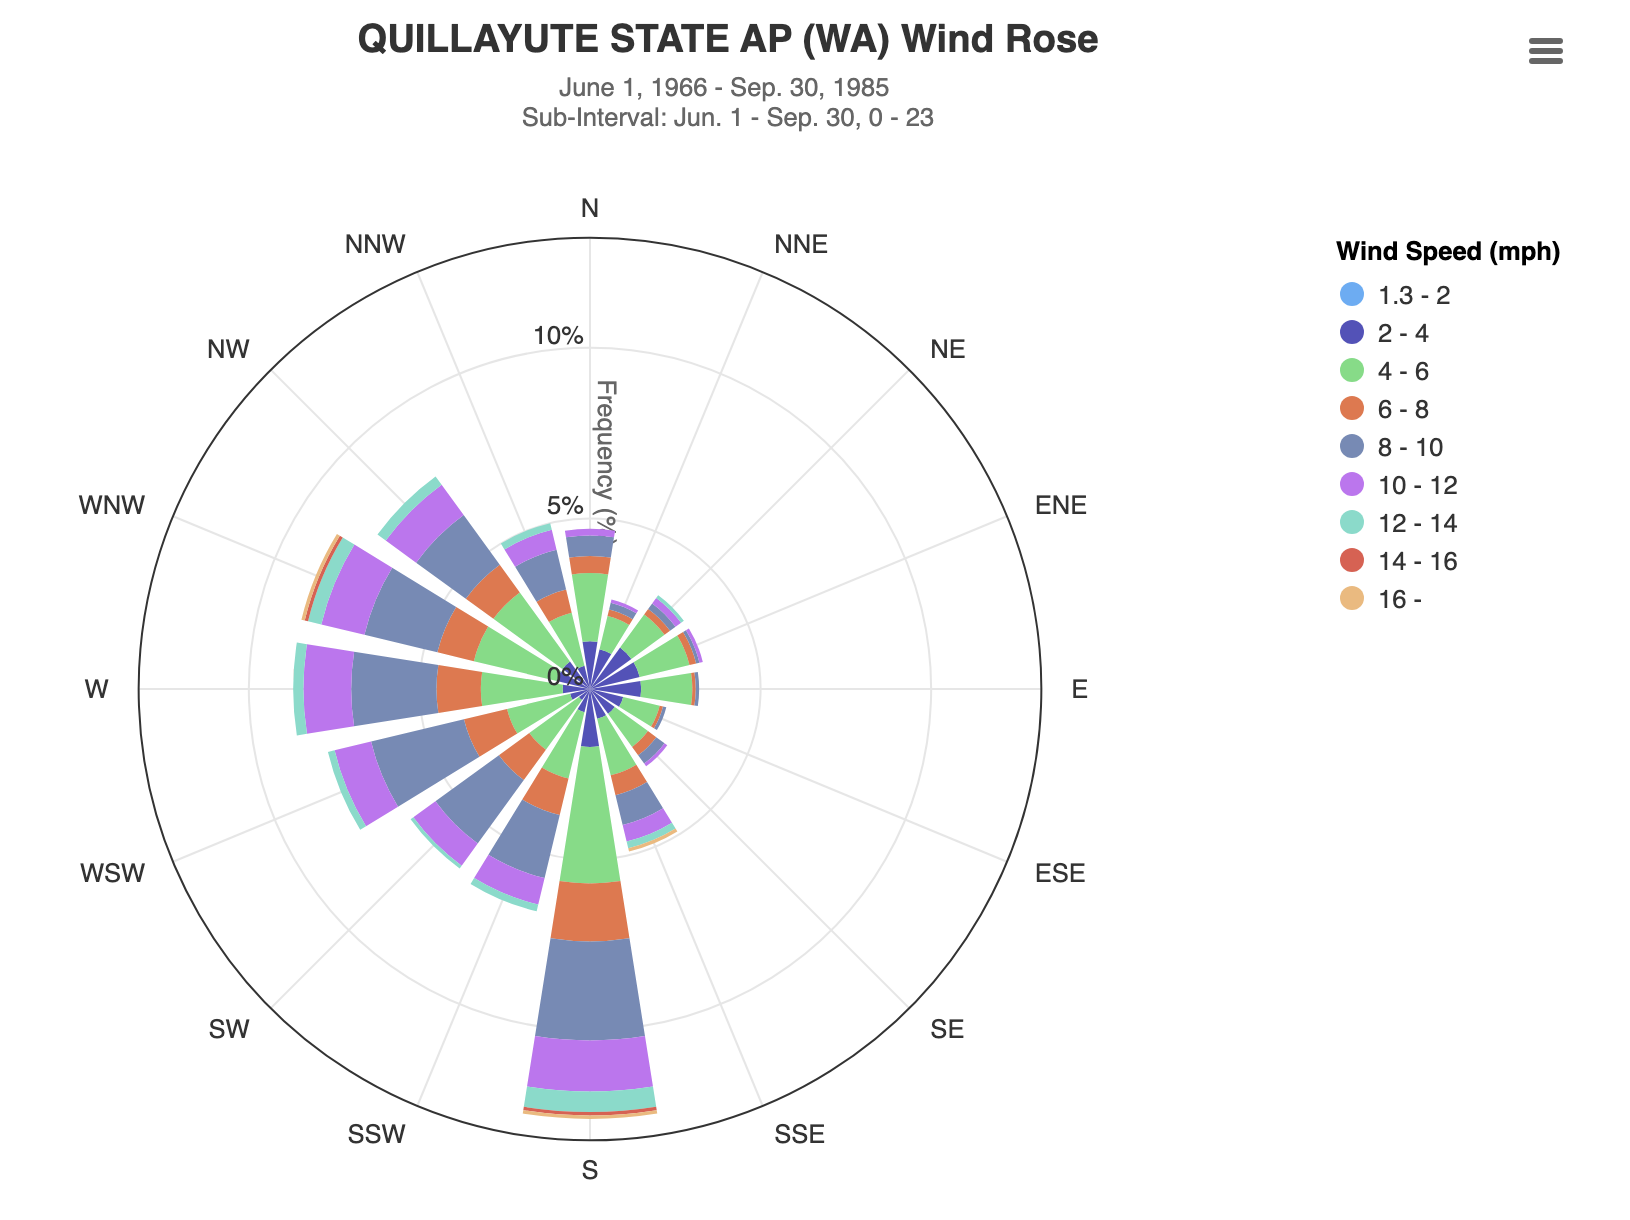 Figure 2a: Wind roses for the months of June through September for 1966-1984 for Quillayute Airport. Both the speed (color-coded) and direction (“S” winds are from the south, for example) of the winds are depicted in wind roses (MRCC cli-MATE).
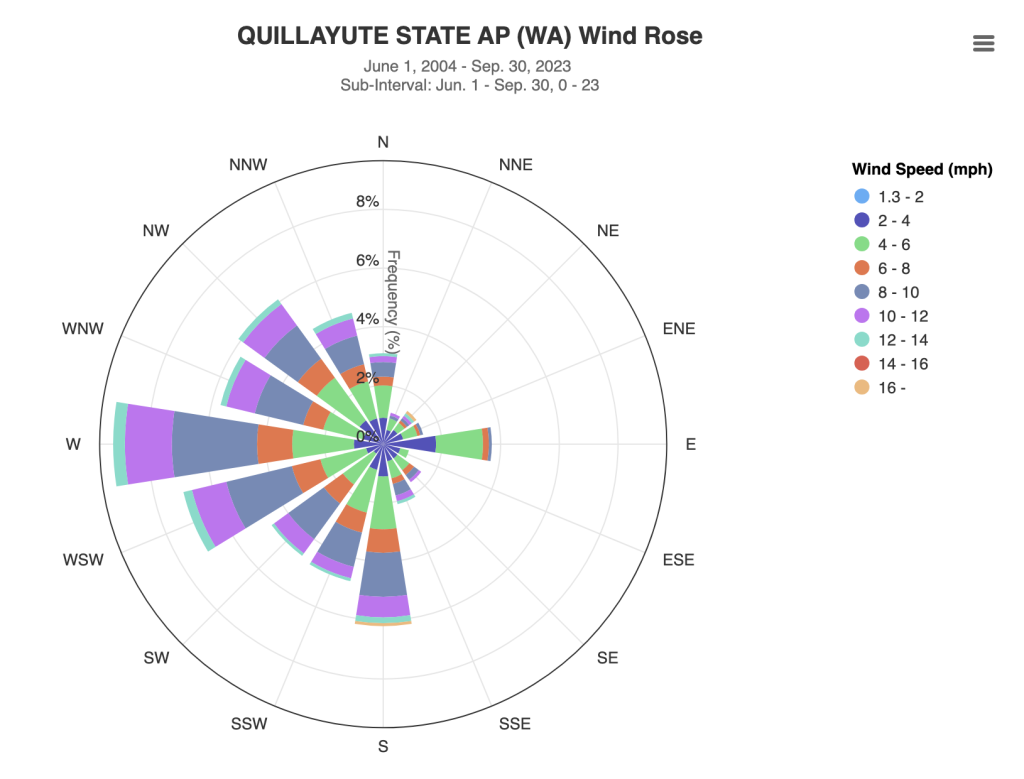 Figure 2b: Wind roses for the months of June through September for 2004-2023 for Quillayute Airport.
Reference
Barth, J.A., Pierce, S.D., Carter, B.R. et al. Widespread and increasing near-bottom hypoxia in the coastal ocean off the United States Pacific Northwest. Sci Rep 14, 3798 (2024). https://doi.org/10.1038/s41598-024-54476-0