By Guillaume Mauger
As we head into the flood season we thought we would dig up a USGS study from a few years back that took a look at past trends in floods (full citation below). This isn’t the only study on the topic, but it’s a classic so we thought it would be valuable to focus just on this one.
Before we dig in to the study, let’s back up to discuss two key points:
First, we like to refer to “peak flows” instead of “floods” for analyses of streamflow like this one. We’re being picky here, but we do this because flooding is affected by other factors, including the elevation and width of the floodplain, the amount of vegetation and other factors acting to slow flows, and the ability of floodwaters to drain downstream. In this and many studies on flooding, we’re actually looking at the amount of water coming down the river, which is one step removed from understanding where the water goes.
Second, it’s helpful to first talk about what might cause a change in peak flows. Peak flows are affected by both the weather conditions that bring rain (or cause snowmelt) and how that water moves across the landscape and through the river network. Both of these factors can change in ways that affect peak flows. For example, warmer conditions lead to more rain and less snow, which should lead to bigger peak flows when all else remains equal. Studies so far have not found a trend in heavy rain events, but more intense rainfall would also generally lead to bigger floods.The same is true for landscape changes – wildfires or logging can lead to larger peak flows downstream. Similarly, landslides and erosion upstream can cause sediment to accumulate in areas downriver; as the river channel fills in it becomes easier to flood.
Now back to the study. They analyzed streamflow observations from hundreds of gauges across Washington State, focusing only on sites that are not affected by reservoirs or other major flow modifications upstream. Because they were looking at long-term trends, they also narrowed things down to only the sites with at least 50 years of observations (through 2014, when their analysis was done), bringing the total down to 83 gauges across the state. Most of the analysis was done by taking the maximum flow for each water year, then seeing if it changed over time (“water years” go from Oct-Sep). (Note: the study also looked at other aspects of peak flows in the region; we’re focusing on the trends analysis)
Figure 1 shows the peak flow record for four example sites. You can see right away that there are different factors affecting peak flows at each site. For the Leach Creek and Stillaguamish River sites, there is clear evidence of an increasing trend, whereas the Nisqually River shows a weak decreasing trend. Crab Creek shows a period of higher flows around 1960, but no clear long-term trend. Both the Nisqually River and Crab Creek sites are odd examples to choose from this analysis, since there are dams upstream of the Nisqually River site, and Crab Creek is heavily influenced by irrigation and the nearby Potholes Reservoir. In both cases the reservoirs began operating in the mid- to late 1940s. For the Nisqually site, we’d expect the dam to hold peak flows steady, since flood control is one of the main functions of many reservoirs. Crab Creek is not as straightforward because irrigation could lead to elevated flows, whereas groundwater withdrawals – mostly for irrigation – could bring flows down. These competing effects make it hard to know what is behind the changes in peak flows at Crab Creek.
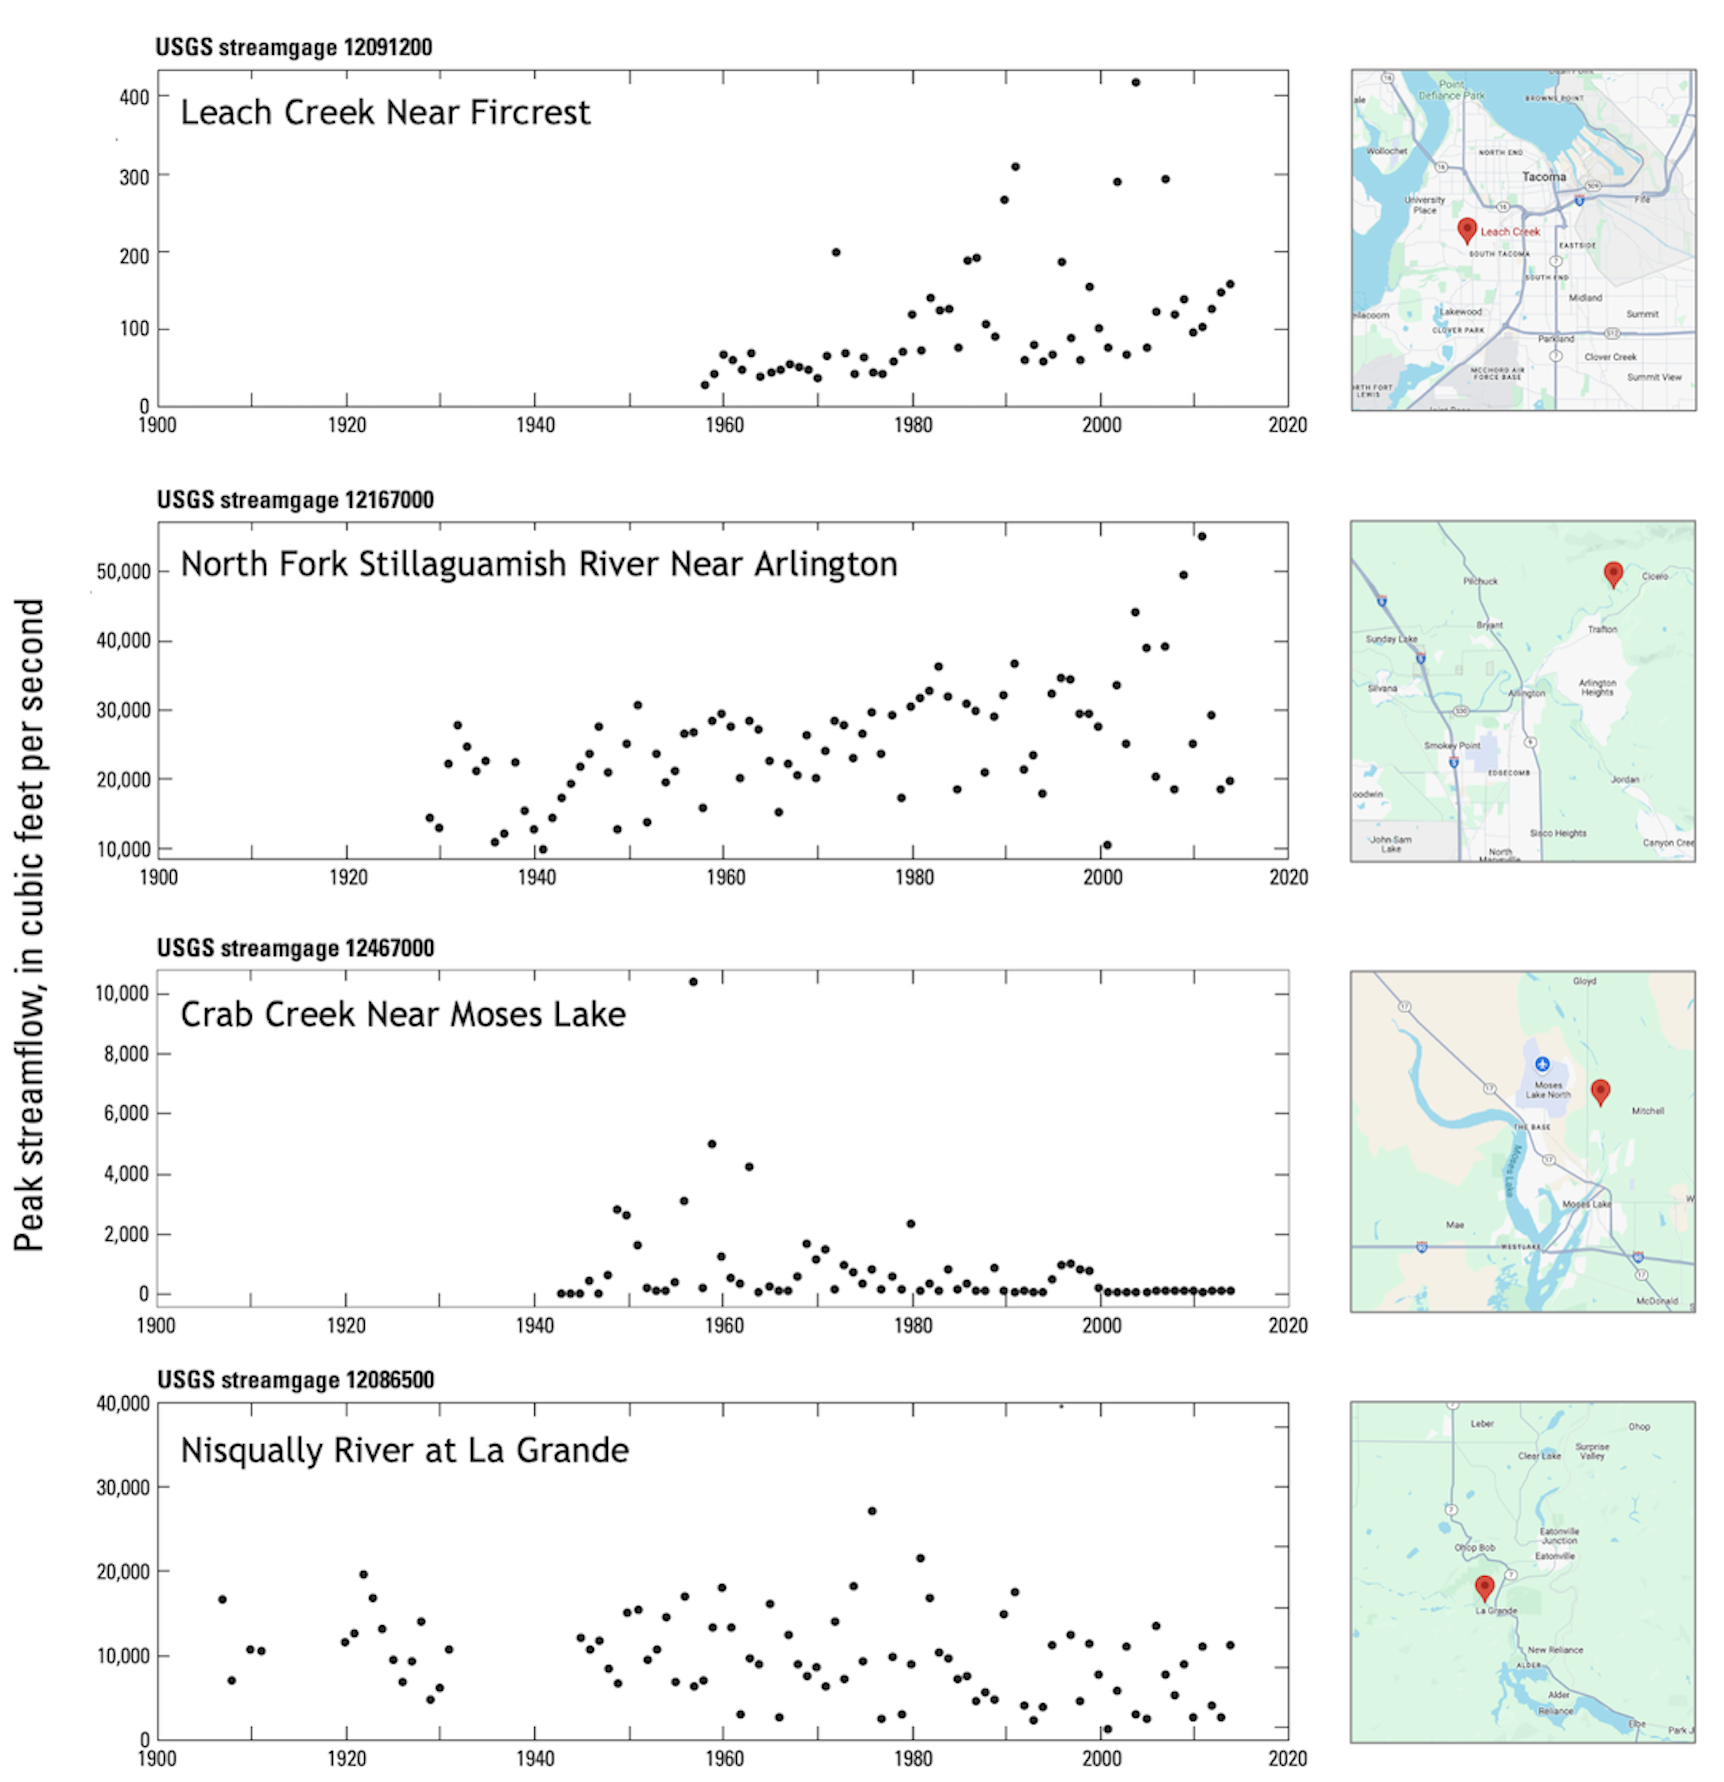 Figure 1: Different locations show different trends. Example peak streamflow records included in the USGS report (Mastin et al. 2018). Maps on the right show the location for each streamgage.
The other thing these plots highlight is that peak flows are highly variable from year-to-year. At the Nisqually site, for example, the annual peak flow can range from less than 1,000 to more than 30,000 cubic feet per second – a nearly 3,000% difference! This highlights a key reason why it’s hard to estimate trends in peak flows: they’re rare. What this boils down to is a sample size problem – if events don’t happen often, it’s hard to observe enough of them to know if they’re changing.
What about other sites? As I mentioned they analyzed trends for 83 gauges across Washington State. Figure 2 shows where they found a positive, negative, or no statistically-significant trend. Their statistics are based on a two-sided Kendall’s tau test. Like a correlation, this test measures how well two quantities rise and fall together. But unlike a correlation, this test is agnostic about the probability distribution of each variable. With extremes the probability distribution is often skewed (with a so-called ‘heavy tail’), which can cause big outlier events to define the statistics. By using the Kendall’s tau test, the results are less sensitive to outliers. They defined “statistically significant” as any trend with greater than 95% confidence.
Of the 83 sites, only 21 showed statistically significant trends. Of those, 16 showed positive trends and 5 showed negative trends. You can see from the map that the positive trends are all in western Washington.
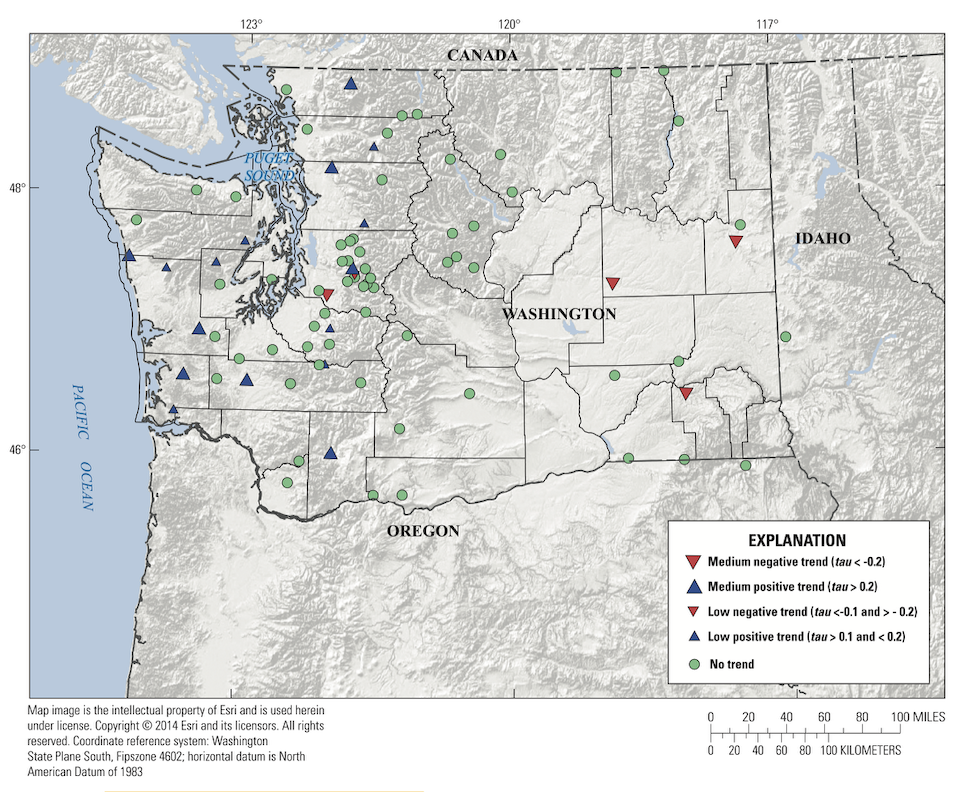 Figure 2: Not many statistically-significant trends. Map showing the trend in annual peak flows for stream gages with at least 50 years of observations (Mastin et al. 2018, reproduced with permission).
So what should we make of these results? First, we can see right away that it’s hard to definitively identify trends in rare events. This study examined trends through 2014. It’s possible the results could be different with ten more years of data, but trends in extremes will always be noisy. Second, it’s clear that there are multiple factors affecting peak flow changes, each of which could lead to trends in peak flows. In eastern Washington, for example, widespread irrigation could raise the water table or lower it, depending on when and where the water is coming from. Similarly, changes to forests or rivers could affect peak flows. To better understand the link to climate, it might be helpful to examine trends in heavy rain intensity and snowpack, the two primary weather conditions that contribute to flooding. We hope to look at those in a future newsletter.
Reference:
Mastin, M. C., Konrad, C. P., Veilleux, A. G., & Tecca, A. E. (2016). Magnitude, frequency, and trends of floods at gaged and ungaged sites in Washington, based on data through water year 2014 (No. 2016-5118). US Geological Survey. https://doi.org/10.3133/sir20165118